
View the THE Sub-Saharan Africa University Rankings 2023 results
The Times Higher Education Sub-Saharan Africa University Rankings are a new university ranking developed specifically to address the challenges faced by higher education institutions in sub-Saharan Africa.
The methodology for the rankings was developed through extensive engagement with university leaders across the region, under a project initiated by a consortium of African and international higher education organisations, and Ashesi University in Ghana. The rankings were developed with support from the Mastercard Foundation.
The ranking follows a hybrid methodology to account for the diverse strengths of the sector; unlike our other rankings which tend to focus on one mission, it covers elements of teaching, impact and research.
The overall methodology explores five key areas, which we call pillars.
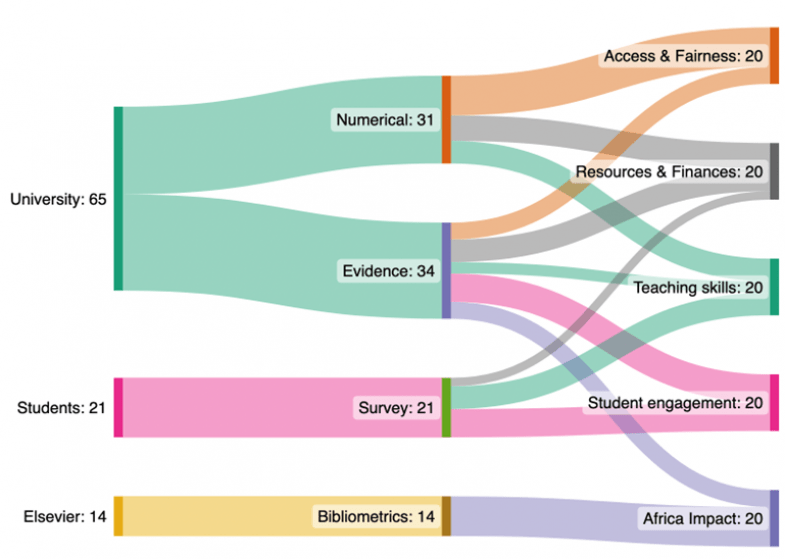
The data
Data collected for this ranking includes data provided directly by universities (continuous data as well as evidence data, which follows the logic of the data we collect in our Impact Rankings), data collected from current students (as part of the student survey) and data supplied by our partner Elsevier (bibliometrics data).
The student survey is a first in sub-Saharan Africa, collecting the opinions of more than 20,000 students from 88 institutions. THE is grateful to participating institutions for their efforts in distributing the survey to their students; this has enabled the collection of a rich data set that highlights the particularities of higher education in the region.
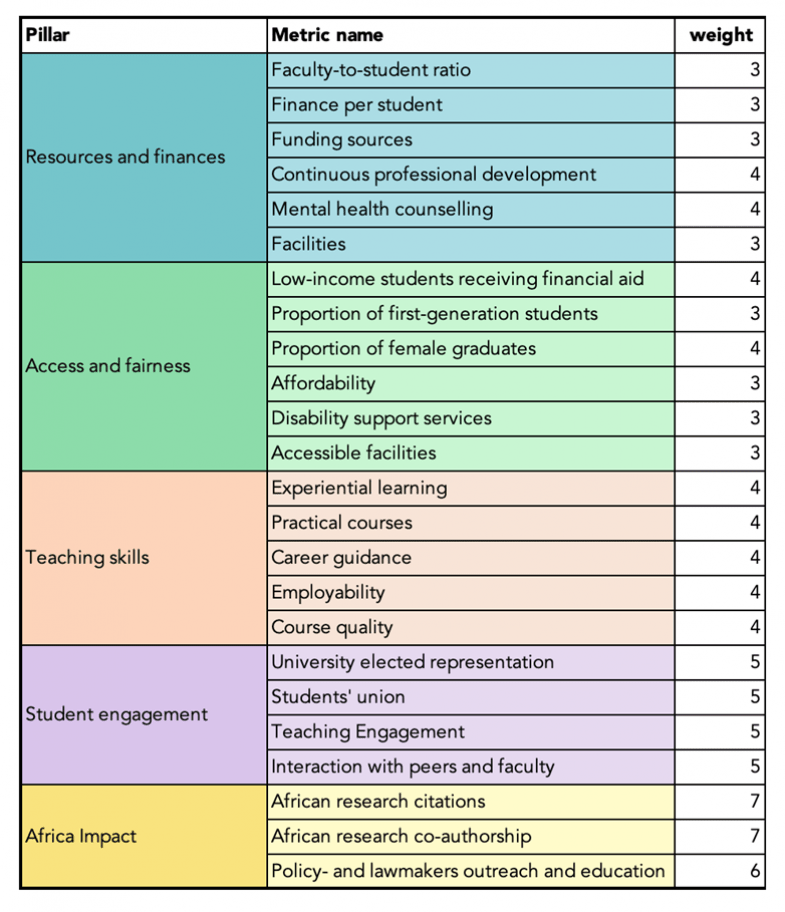
Resources and finance
This pillar rewards financially stable institutions that are able to provide a high-quality learning experience.
It includes metrics on finance (income) per student (3%), which shows whether the institution has the money to effectively deliver teaching, and the faculty-to-student ratio (3%), which gives a sense of whether it has enough teaching staff to provide interactive learning.
To account for the financial stability of institutions, we look at the diversity of funding sources (3%), which measures how well distributed the funding system of the institution is (and how resilient it might be to sudden drought from any source).
We also look at how students rate the quality of the facilities (3%) and whether institutions offer (and require) continuous professional development (4%) to/from their teaching staff, as well as offer their students mental health counselling (4%) (free or not).
Access and fairness
With this pillar, we aim to account for the openness of institutions to students of all backgrounds, and how they ensure all can succeed.
The metrics that comprise it measure the percentage of first-generation students (3%) as well as low-income students (4%) (who receive poverty-linked financial aid); we also measure the proportion of female graduates (4%).
Two evidence-based metrics look at disability access (3%) and disability support (3%).
Those five metrics are all based on measurements present in our Impact Rankings – SDG 1 (No poverty), SDG 5 (Gender equality) and SDG 10 (Reduced inequalities).
An additional metric for this ranking is affordability (3%), which looks at the median tuition and fees paid by students.
Next we look at the educational process itself. This is split into two pillars, each of which is concerned with a different mission of higher education.
Teaching skills
In this pillar, we measure the skills-building that institutions provide, and their ability to equip students with the required tools to enter and be successful in the world of work.
We measure the percentage of undergraduate students who experience practical learning courses (4%) and experiential learning (4%) (either community service or work placement) during their year.
We also ask students to evaluate employability (4%) by asking whether the teaching they are receiving will help them secure a job after their graduate; and to evaluate teaching quality (4%), both the teaching itself and the curriculum.
Finally, we ask institutions what career guidance services (4%) they provide.
Student engagement
Here we look at what, other than skills and work-readiness, institutions provide students. Although employability is a key goal of higher education, providing intellectual growth and engagement as a citizen is also crucial to empowering the continent’s next generation.
The first two metrics are based on the student survey. Responses to six questions are used in the following manner:
- The teaching engagement metric (5%) uses scores from four questions, asking to what extent teaching at the university (1) supports critical thinking, (2) supports making connections among the things students have learned, (3) supports applying the students’ learning to the real world and (4) offers classes that challenge the students.
- The interaction with faculty and peers metric (5%) uses scores from two questions, asking how many opportunities the students have to (1) interact with the staff and faculty and (2) collaborate with their peers.
To measure civic engagement, we also ask universities if they recognise an independent students’ union (5%) (and whether it has input into the university’s governance), and whether they have elected representation (5%) among various groups (including students). Those two metrics are adapted from those in our Impact Ranking – SDG 16 (Peace, justice and strong institutions).
Africa impact
This final pillar is concerned with the ways in which higher education can be a force for good in the region and help build a rich collaborative network.
We look at the research produced by institutions: is this research used by other researchers in Africa (African citation – 7%) and is it the result of African collaboration (African co-authorship – 7%)? Those two measures are normalised by the total research output.
We also ask universities whether they provide outreach, general education, upskilling and capacity-building to policy- and lawmakers (policymakers and lawmakers outreach – 6%). This is another metric also used in our Impact Ranking – SDG 16 (Peace, justice and strong institutions).
Inclusion criteria
A total of 121 universities participated in the data collection. Of those, 88 also had enough student survey responses (the minimum required is 50 valid responses) – only those 88 universities have scores for all metrics, and an overall score and rank.
The 33 universities with incomplete data have pillar scores, but are not ranked overall.
The only requirement to participate in the SSA ranking is to teach undergraduate students. We welcome participation from a wide range of institutions, from large public universities to small vocational schools.
If you would like to enquire about participation in future editions of this ranking, please contact us at ssaranking@timeshighereducation.com
Register to continue
Why register?
- Registration is free and only takes a moment
- Once registered, you can read 3 articles a month
- Sign up for our newsletter
Subscribe
Or subscribe for unlimited access to:
- Unlimited access to news, views, insights & reviews
- Digital editions
- Digital access to THE’s university and college rankings analysis
Already registered or a current subscriber? Login


