Click here for a larger version of the graph
Browse the full results of the World University Rankings 2018
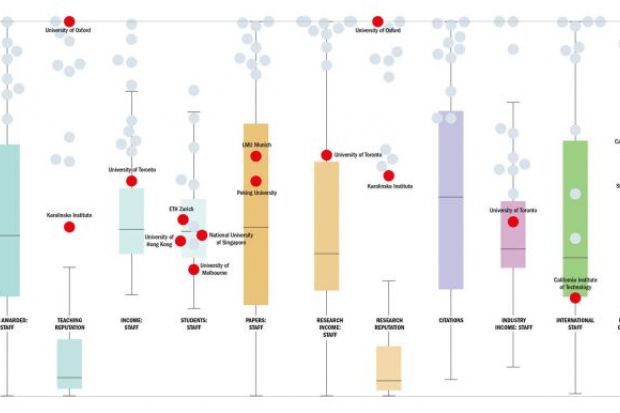
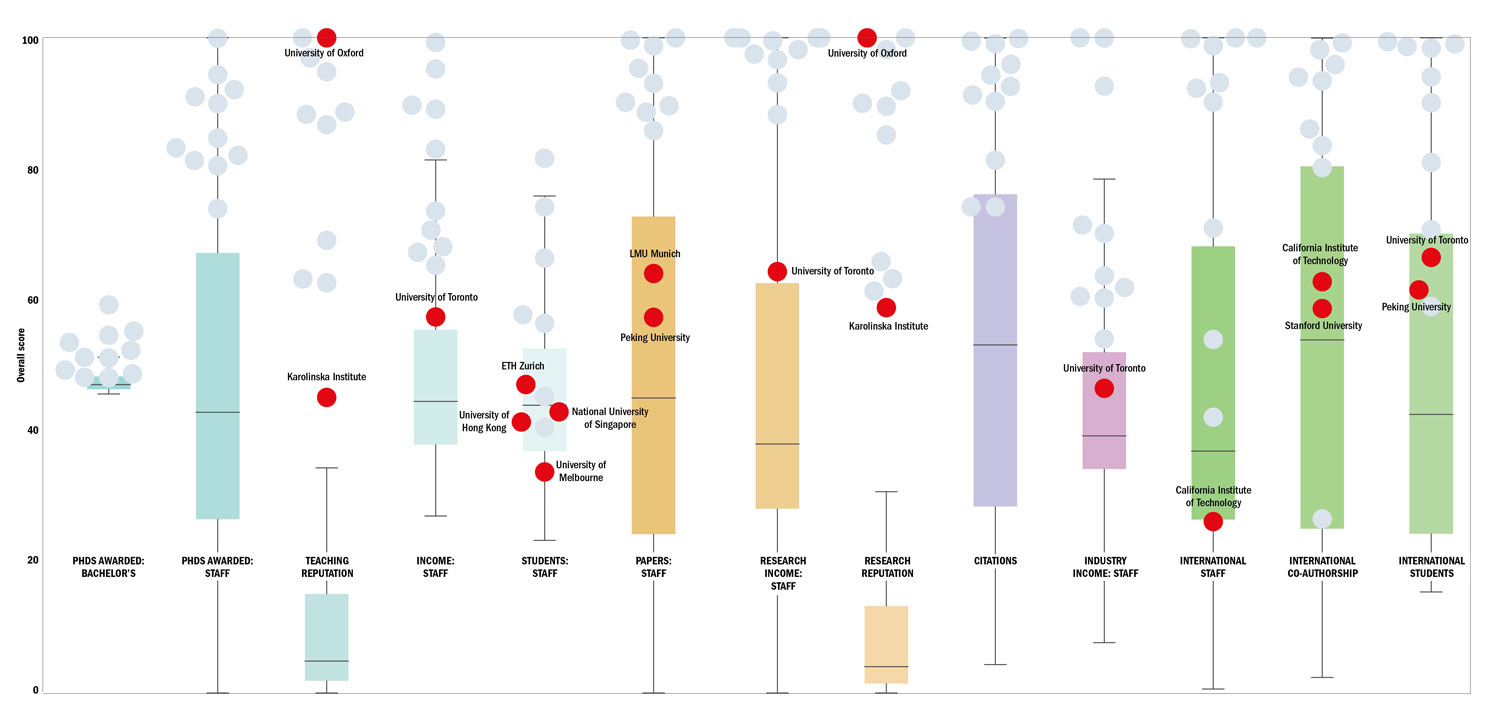
It might be expected that the top performers in the Times Higher Education World University Rankings 2018 in each country would excel across the board, but this graph neatly shows that this is not necessarily the case.
The chart shows the distribution of all universities in the ranking across the 13 metrics that underpin the list, drawn from the THE DataPoints benchmarking tool. Each set of box and whiskers represents where the bulk of institutions sit on each metric (the box covers the interquartile range, while whiskers show the highest and lowest institution within 1.5 times the interquartile range from the median, which is shown by the middle line).
Each dot represents the position of the top university, by overall score, in each of the 10 countries that feature in the top 40 of the ranking (there are 11 institutions because the California Institute of Technology and Stanford University share third position).
For the most part, the overall top-performing universities comfortably outperform the bulk of institutions. This is especially true on metrics such as teaching and research reputation, where the best-known institutions consistently notch up votes (note the University of Oxford’s position, for example). At the same time, it is noticeable that institutions that are not household names, such as Sweden’s Karolinska Institute, score lower on reputation.
Download a copy of the World University Rankings 2018 digital supplement
On other metrics, however, patterns emerge where some countries’ best universities have ground to make up. One key trend is visible on the international outlook pillar: North America’s leading lights tend to score relatively poorly on metrics such as international staff (Caltech), international co-authorship (Caltech and Stanford) and international students (the University of Toronto). China is another laggard in this area, as evidenced by Peking University’s position.
Given that international outlook represents only 7.5 per cent of overall scores in the World University Rankings, it tends to be outweighed by strong performance elsewhere. For instance, as well as on reputation (research and teaching reputation together account for a third of a university’s overall score), most of the universities make a healthy showing on citations (30 per cent of the overall score).
But there are other individual metrics with an interesting spread of scores. These include staff-to-student ratio, where the University of Melbourne comes in under the lower quartile, and five others (including ETH Zurich – Swiss Federal Institute of Technology Zurich, the National University of Singapore and the University of Hong Kong) are bunched around the median. The measure of papers per academic staff is also interesting, with Peking and LMU Munich scoring above the median but not as well as other members of the elite.
Meanwhile, Toronto is noticeable as a university that trails the others on income measures: for overall, research and industry income, it comes bottom among the group, although still comfortably above the world average in each case.
Register to continue
Why register?
- Registration is free and only takes a moment
- Once registered, you can read 3 articles a month
- Sign up for our newsletter
Subscribe
Or subscribe for unlimited access to:
- Unlimited access to news, views, insights & reviews
- Digital editions
- Digital access to THE’s university and college rankings analysis
Already registered or a current subscriber? Login


