
For many vice-chancellors, the 2018 results of the UK’s teaching excellence framework will have come as something of a relief. Providers including the universities of Liverpool and Southampton were among 13 higher education institutions that took the gamble of re-entering the assessment and managed to improve on their 2017 rating.
The results may have been particularly welcome for Russell Group institutions, which perhaps faced the most reputational damage if they were perceived to have underperformed, especially for Liverpool and Southampton, which moved up from the bottom bronze category to silver. Durham University and the University of York, meanwhile, went up from silver to gold, the top rating.
Coming just a year after the last round of results, however, these ratings raise an important question: do they reflect genuine improvement in teaching standards or changes to the exercise’s methodology, which were perceived as being beneficial to Russell Group members?
At Durham, pro vice-chancellor (education) Alan Houston unsurprisingly makes the case for the former argument.
“Last year’s assessment showed that our mature students’ continuation and employment rates were lower than we would have hoped, so we developed new mentoring and revised their curriculum,” he said. “In that sense, the TEF did what it was supposed to: it gave us insight into areas [where] we needed to improve and we are now in the process of doing just that.”
Professor Houston added that the university was also able to show that all institutions in north-east England that submitted to the TEF had been negatively graded for mature students’ employment, as well as employment more generally. “Last time, we didn’t have an effective response to this particular metric, but as a consequence of last year’s TEF we had a clearer understanding,” he said.
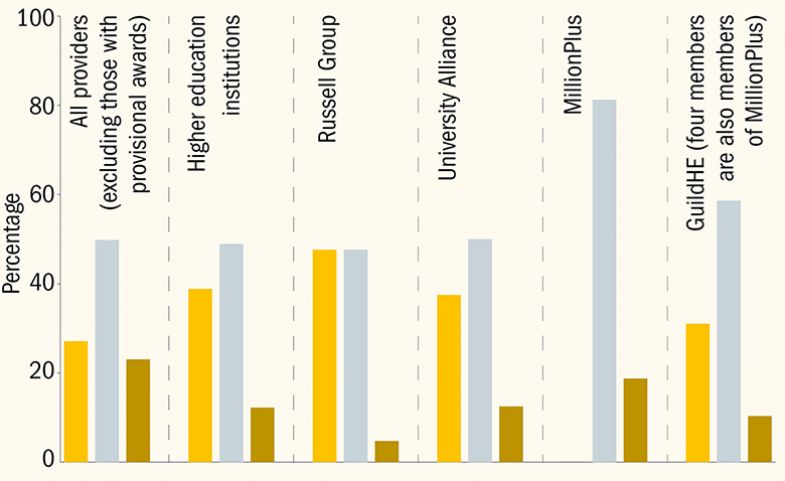
TEF awards by mission group
The complexity of the “core” metrics used to measure graduate employment, student retention and satisfaction has been an issue since the first iteration of the TEF but has come under further scrutiny in 2018.
The crucial difference in the TEF this year was that, when assessors were making an initial judgement about whether a university was gold, silver or bronze, the weighting given to three of the metrics – those drawn from the National Student Survey – was halved. “Supplementary” metrics were introduced this year, too, including some on graduate employment and salaries, using the government’s Longitudinal Education Outcomes (LEO) data.
The significance of these changes is that Russell Group institutions typically fare less well in the NSS, but usually perform strongly in graduate employment data.
Of the five Russell Group institutions that resubmitted this year, only the University of Warwick failed to improve its rating, remaining a silver institution. Graduate employment was cited by the TEF panel in its reasons for awarding both York and Durham gold, and Southampton silver, although this was not the case for Liverpool.
The introduction of supplementary metrics, also including one intended to deter grade inflation, suggests that the assessment panels are playing an increasingly significant role in TEF judgements. Analysis by Times Higher Education has found that, in 2018, institutions were more likely than last year to move between silver and gold, and bronze and silver, from after the initial “core” assessment.
THE put together a summary table of performance on the core metrics. Institutions in the TEF were given a flag if they performed significantly well or badly (in a statistical sense) compared with a benchmark value in each of the six core metrics.
An institution could have achieved one of five different flags in each metric: ++ (if they performed particularly well against the benchmark), + (if they performed well), = (if there was no statistically significant difference from the benchmark), − (if they performed badly against the benchmark) and −− (if they performed particularly badly).
Our table shows the number of times that an institution achieved a flag in each category and is sorted by TEF award, then flag performance and finally by average Z-score across the six metrics. A Z-score is a numerical value that expresses how far the institution deviated from the benchmark in a particular metric.
Taking into account the changes to this year’s methodology, we added a column showing a weighted flag score achieved by each university. We calculated this by giving any positive flag a 1 (or 0.5 in an NSS metric) and any negative flag −1 (or −0.5 in an NSS metric). Equal flags score zero.
The resulting data give a clue to which universities would have been initially seen as gold, silver or bronze: gold institutions were those scoring positive flags amounting to 2.5 (but, importantly, no negative flags) and bronze institutions were those scoring negative flags amounting to 1.5 (regardless of other flags).
Performance on the core metrics
It allows us to see which universities must have shifted from an initial assessment. They include the University of Liverpool, which hits the 1.5 bronze threshold for negative flags but ended up with silver, and also the University of York, which ended up with gold despite getting only two positive flags in NSS categories.
The difficulty is that after this core assessment, many other factors came into play: absolute performance on metrics; how an institution did in “split” metrics looking at specific groups of students; its results in supplementary metrics and, of course, the written submission.
The analysis indicates that anyone – including students – trying to understand in a simple way why a university has achieved a certain rating has their work cut out. Things are set to get even more complicated as the plans for a subject-level version of the TEF move from consultations and pilots to practice.
Paul Ashwin, professor of higher education at Lancaster University, said that the fact that a large proportion of higher education institutions that had re-entered had had their ranking changed – 13 out of 20 – made the whole exercise problematic.
“It raises questions about what’s being measured and how long that lasts for. If the ranking doesn’t stay the same over just a year, it’s not possible for the TEF to provide useful information for prospective students,” Professor Ashwin said.
“Institutions got their results in June 2017, then had to resubmit by January 2018, that’s only six months,” he pointed out. “It’s not enough time to make substantial changes in teaching. So, either these institutions have got better at writing their submissions or the adjustments in the metrics have made a big difference, and that calls into question what the previous round of rankings means.”
Meanwhile, broader concerns over the validity of the TEF metrics and the exercise as a whole persist. The London School of Economics, which got bronze last year, chose not to re-enter in 2018, arguing that it had improved its teaching standards but that the TEF would not “fully capture” these. The LSE is now the only Russell Group institution rated bronze. London-based institutions have long complained of a “London effect” in the TEF, with the cost of living in the capital perceived as dragging down institutions’ performance on satisfaction and retention.
Soas, University of London – another world-renowned institution – re-entered the TEF this year but was again put in the bronze category. Deborah Johnston, its pro-director of teaching and learning, criticised the TEF for “the bluntness of its limited data”.
“The TEF raises a lot of issues in the way that it assesses teaching and outcomes, particularly for smaller and international-facing institutions,” she said.
Professor Johnston highlighted that a large proportion of students at Soas were from overseas, or chose to work internationally after graduation.
“Two of the three new supplementary TEF metrics use the LEO data, which does not include international students,” she said. “Worse still, LEO data explicitly penalises institutions with global ambitions for UK students, since every UK graduate working overseas is actually counted as if they are unemployed in the UK, and therefore as a negative in the LEO employment rate,” she said.
Universities will hope that these issues will be addressed in a planned review of the TEF. However, the exercise does not look as if it is going to disappear any time soon, and it is impossible to ignore the argument that the exercise has shone a much-needed light on teaching in higher education.
Diana Beech, director of policy at the Higher Education Policy Institute, said that the latest round of results showed that “institutions have gone back to the drawing board and reflected not only [on] what data they can use to show they have good teaching, but [on] what changes should be made on the ground”, she said.
“As the TEF evolves, so too will institutional ability to handle and interpret the TEF assessment criteria effectively. What we should now start to see is institutions from across the sector being rightly recognised for the pockets of teaching excellence they provide, not hampered by doubt about how best to formulate the required provider submissions,” she said.
POSTSCRIPT:
Print headline: Play to win: how to explain status updates in the TEF?
Register to continue
Why register?
- Registration is free and only takes a moment
- Once registered, you can read 3 articles a month
- Sign up for our newsletter
Subscribe
Or subscribe for unlimited access to:
- Unlimited access to news, views, insights & reviews
- Digital editions
- Digital access to THE’s university and college rankings analysis
Already registered or a current subscriber? Login


