Big data analytics at Modul University Vienna predict mobility bottlenecks and help commuters avoid longer travel times that contribute to pollution and climate change
The EcoMove project (426,968 € over three years) developed new AI-based methods to combine anonymised mobility data with automated knowledge extraction from Web and social media sources to predict mobility bottlenecks in the City of Vienna. Modul University Vienna’s big data analytics platform webLyzard captures and analyses the public debate across online channels to extract and organise knowledge about future events in Vienna (e.g., concerts) and infrastructure projects (e.g., building work or road closures). A deep learning neural network is trained with past knowledge correlated with mobility data to learn about their interrelationships, enabling predictions regarding the impact of future events on mobility patterns.
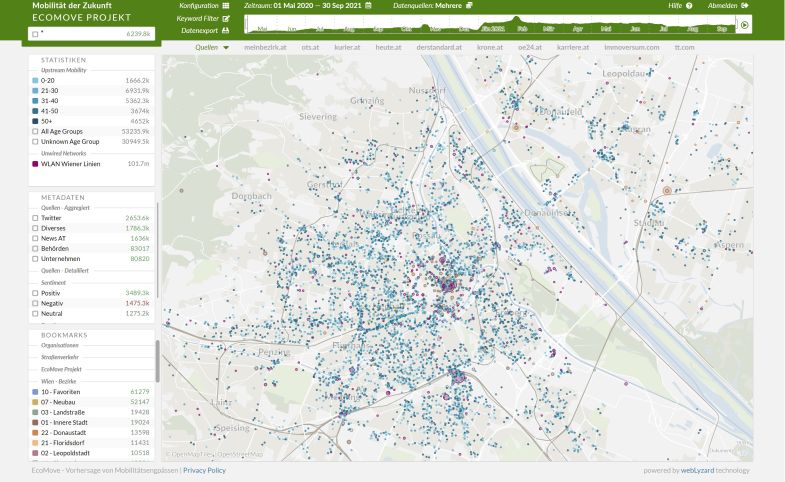
A Web-based dashboard (screenshot above) enables professional stakeholders to make mobility-related decisions as well as provide locals and tourists with meaningful insights into future mobility conditions so that they can make environmentally optimal travel decisions.
Together with three Viennese companies, Modul University Vienna has developed innovative data analytics and visualisation solutions for future mobility use cases in the EcoMove project.
SEMANTIC DATA INTEGRATION
The first innovation has been to use public, online data to identify and learn about mobility behaviour. Social media postings, news articles as well as local blogs and Web crawls over traffic and transportation websites are all analysed by Modul University Vienna’s advanced data pipeline with state-of-the-art NLP, keyword and entity detection capabilities across multiple languages. Monthly more than a million documents are analysed from the identified sources.
FINE GRAINED DATA VISUALISATION
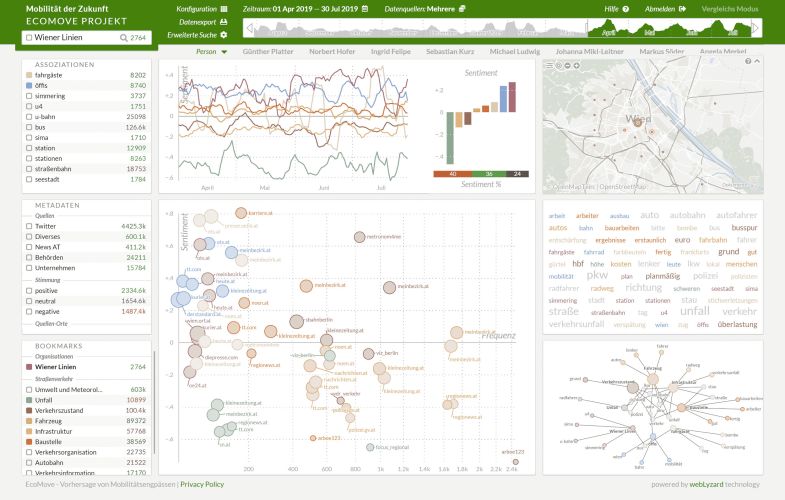
Interactive data visualisation helps to make sense of the collected data and the results of complex analytic methods. Modul University Vienna’s big data analytics platform webLyzard provides trend charts, keyword association graphs, tag clouds and sentiment analysis among other tools for business intelligence from digital content streams. In the EcoMove project, we trained our data pipeline to identify locations down to street level and provide map overlays for data analytics for each street.
MOBILITY PREDICTION
The visual analytics dashboard of EcoMove supports the exploration of future events, built on top of deep learning networks for predictive analytics to anticipate future mobility states at Vienna locations. The extracted knowledge goes beyond pure statistical extrapolation such as trend-based forecasting from time-series data and includes anticipated future events and states, e.g. knowing that a concert will take place nearby or that a parallel road will be closed, which can indicate hotspots of activity at a specific location. These insights are intended to nudge city commuters to change their mobility behaviour in an environmentally friendly manner, for example by not making the trip or at least using a less congested route. Thereby the project aims to contribute to more sustainable behaviour, which is a declared goal of Modul University Vienna reflected across many of its research projects and degree programs.
Find out more about Modul University Vienna’s Research Centre for New Media Technology