
Latest TEF news and analysis
"If the TEF had just replicated existing hierarchies, then the whole thing would have been completely and utterly pointless.”
This view, voiced by Nick Hillman, director of the Higher Education Policy Institute, is one justification for an exercise whose inaugural results, released last week, caused considerable ripples in the media by lumping world-leading research institutions such as the London School of Economics in the same “bronze” category as some of the sector’s traditional post-1992 whipping boys, while elevating some less celebrated institutions into the gold category.
“The fact that you have Edge Hill and Portsmouth [universities] and some further education colleges up there in gold is quite exciting,” says Hillman, who was a ministerial adviser when the idea of a national university teaching assessment was first being mooted.
The debate about whether the exercise genuinely measures anything meaningfully related to teaching quality will go on and on. But as the initial celebrations and commiserations begin to die down, another elephant in the room demands attention: does the exercise treat every university fairly?
On the face of it, it does. Each award category – gold, silver and bronze – contains a wide range of institutions in terms of age, size and remit. But dig a little deeper into the statistics underlying the teaching excellence framework (TEF) and questions begin to arise about how final awards were made – and, in particular, why some large institutions saw their awards bumped up by the assessment panel while others did not.
The initial assessment of which category a university should be placed in was made on the basis of six metrics. Three of those relate to questions in the National Student Survey: teaching on my course; assessment and feedback; and academic support. The others are non-continuation; graduate employment or further study; and highly skilled employment or further study (see graph below). In particular, assessors looked at how many times a university was “flagged” as having a statistically significant gap between its overall “core” performance on each metric and its benchmark, which takes into account factors such as the age of students and their field of study (and others, depending on the metrics).
Measuring up: the top and bottom five institutions on each metric
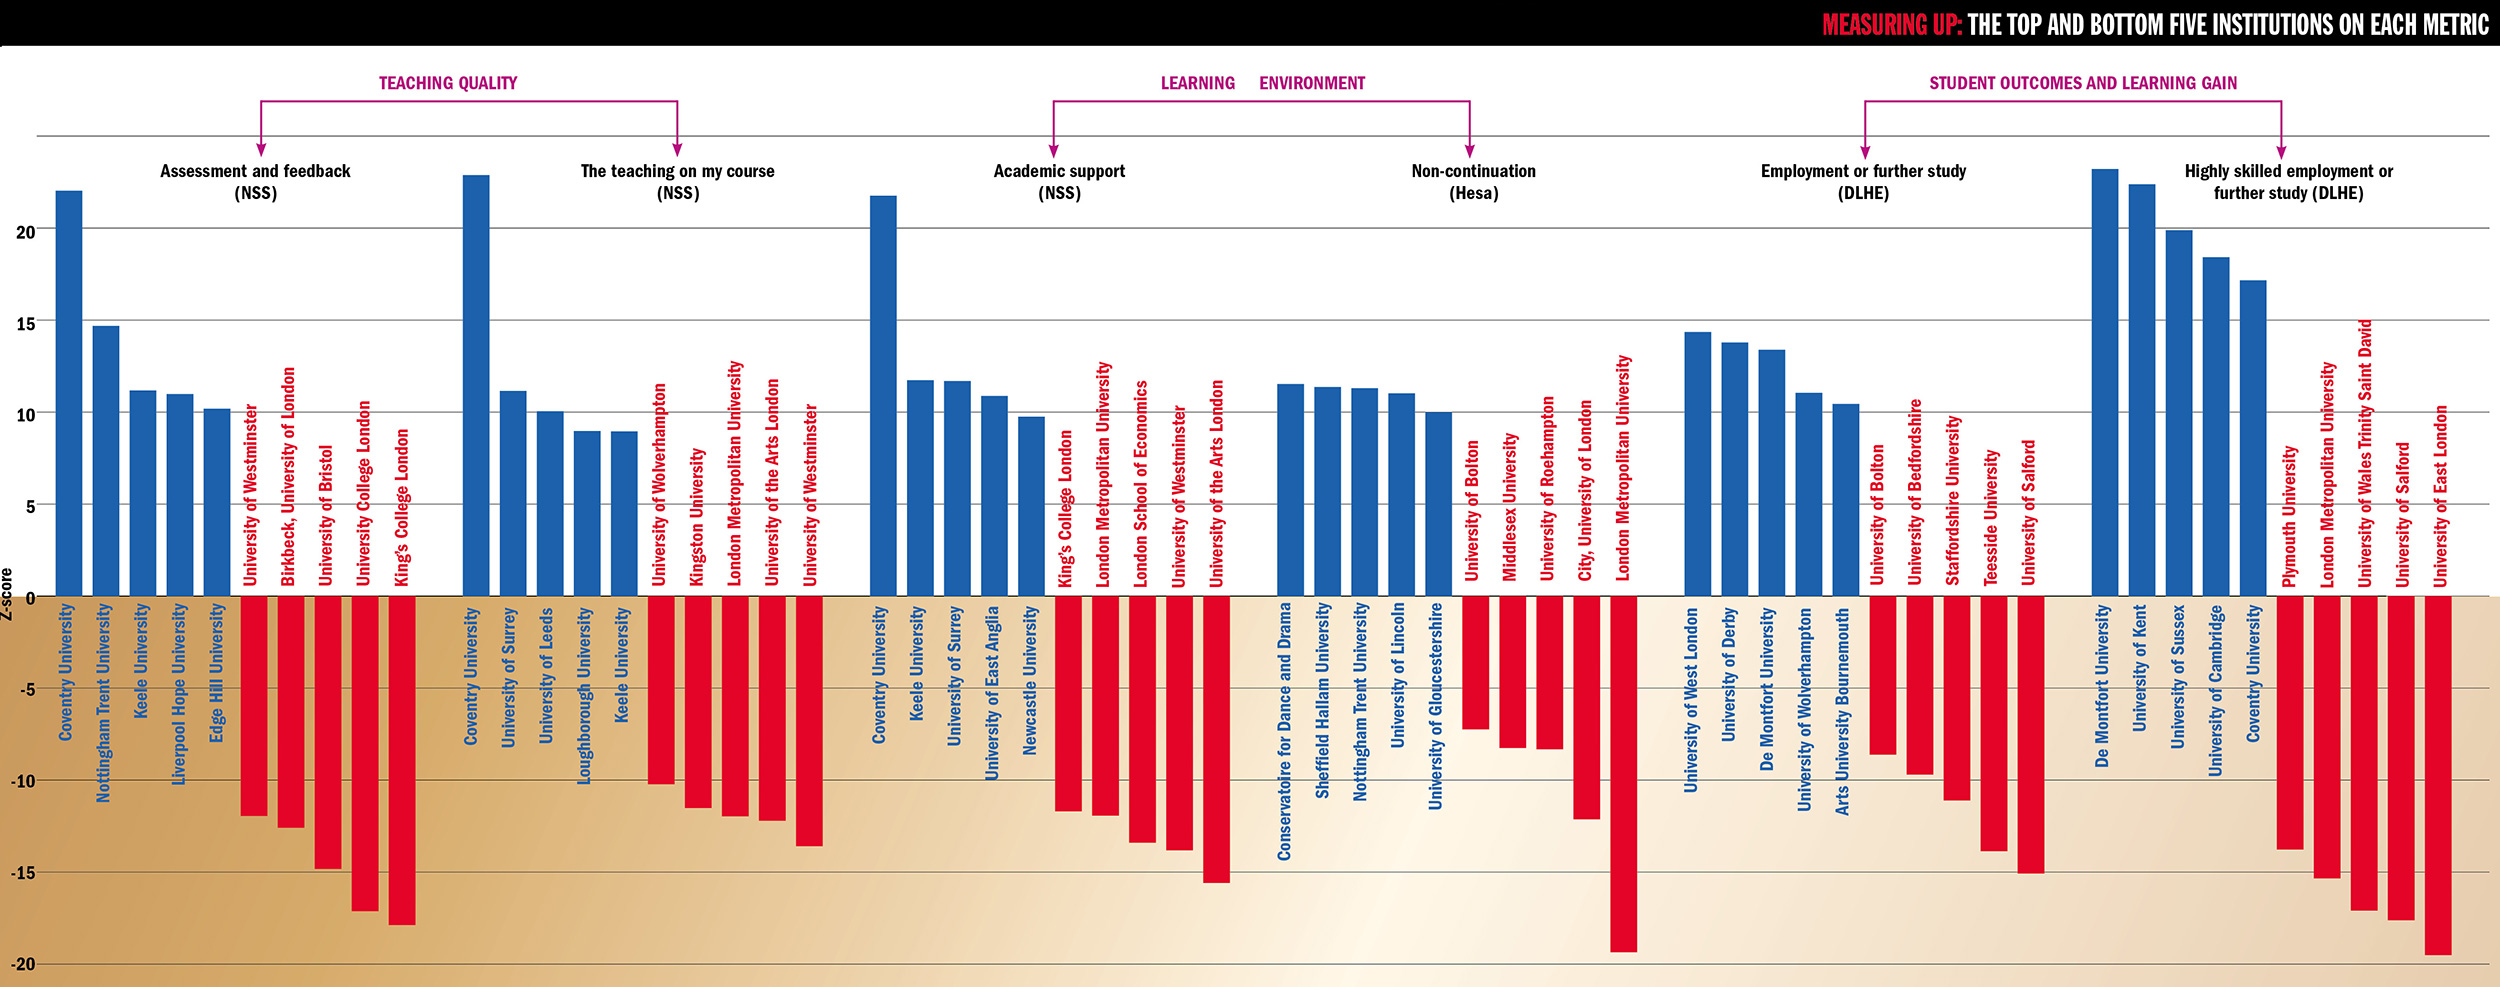
Click to see large/hi-res version
Institutions with three or more “positive” flags, and no negative flags, were initially rated gold; those with at least two negative flags were rated bronze. Every other institution was initially graded silver. Although these assessments have not been published, they are easy to carry out on the basis of data released last week by the Higher Education Funding Council for England, which oversaw the TEF. Hence, it is possible to see which universities received a final award that differed from their initial assessment after written submissions from institutions and other factors were considered.
Of the 140 higher education institutions and alternative providers included in Times Higher Education’s analysis, almost a quarter (34) fall into this category. These are indicated in our TEF ranking (see below), which is based, first, on the final TEF award, but is then sorted by the number of significance flags gained across all the metrics – and finally by a statistical measure of the distance a university is from its benchmark across all categories, the Z‑score.
Source: Hefce/Analysis by THE. Note: Table is based on core metrics for an institution’s majority provision (full-time or part-time). Three of BPP University’s metrics did not return a flag as there were not enough data to form a benchmark.
View these two tables combined, plus the methodology
Many of those moving from their initial assessment – upwards, in all cases except that of Bucks New University – can be seen to be at the gold/silver or silver/bronze border. And conspicuous among them are a relatively high number of large research-intensives from the Russell Group. These institutions make up eight of the 33 whose awards were bumped up: more than a third of the 21 Russell Group universities that entered the TEF (Queen’s University Belfast and the universities of Edinburgh and Glasgow did not participate).
Further analysis of performance on the core metrics by Paul Ashwin, professor of higher education at Lancaster University, shows that a number of institutions could be deemed “lucky” or “unlucky” to have received their final award given their relative performance on the metrics alone. For instance, six received gold despite having only one positive flag (a fair way below the three needed for an initial gold assessment). These include the Royal Veterinary College (which was also the only institution to move from an initial bronze rating to gold) and four Russell Group institutions: Newcastle University, Imperial College London, the University of Nottingham and the University of Leeds.
“Lucky” silvers (which had at least two negative flags but no positive flags) include four modern universities (London South Bank, Bournemouth, Leeds Beckett and the University of Central Lancashire) as well as King’s College London and the University of Bristol.
For Ashwin, it is “remarkable” that so many Russell Group universities appear on the list of “lucky golds” and “lucky silvers” while at the same time they are absent from the list of institutions that seem “unlucky” to have missed out on higher TEF awards (such as silver-rated institutions with at least two positive flags). Ashwin also points out that several Russell Group members are among the gold and silver institutions with the lowest average Z-scores while not so many appear among silver and bronze institutions with the highest Z-scores – exceptions being Durham University (silver) and the University of Southampton (bronze).
Such findings might be related to the nature of large research-intensive institutions, Ashwin suggests, and once other contextual factors are examined, the factors behind their apparent “luckiness” could become clearer. Also, there are plenty of non-Russell Group institutions that were also moved up a band. However, the findings are bound to raise questions about the integrity of the exercise given the early concern that although on paper (in other words, according to the metrics) some Russell Group universities might do relatively badly, they would fight tooth and nail to ensure that contextual and qualitative considerations would spare their blushes.
Any suggestion that lobbying from university groups could have played a part in TEF outcomes are rejected outright by Chris Husbands, the chair of the exercise. He says: “Although the specification for TEF was produced by staff in [the Department for Education], the delivery of the specification through the assessments has been conducted entirely independently of government. There were no DfE staff involved in the assessment meetings and, remarkably in my experience, ministers were not informed of the results of the assessments, which could be perceived as having major reputational consequences for them, until after the participating institutions and only two days before they were made public. There has, therefore, been no lobbying for specific results of any kind.”
Groupthink: the percentage distribution of Z-scores for different groups
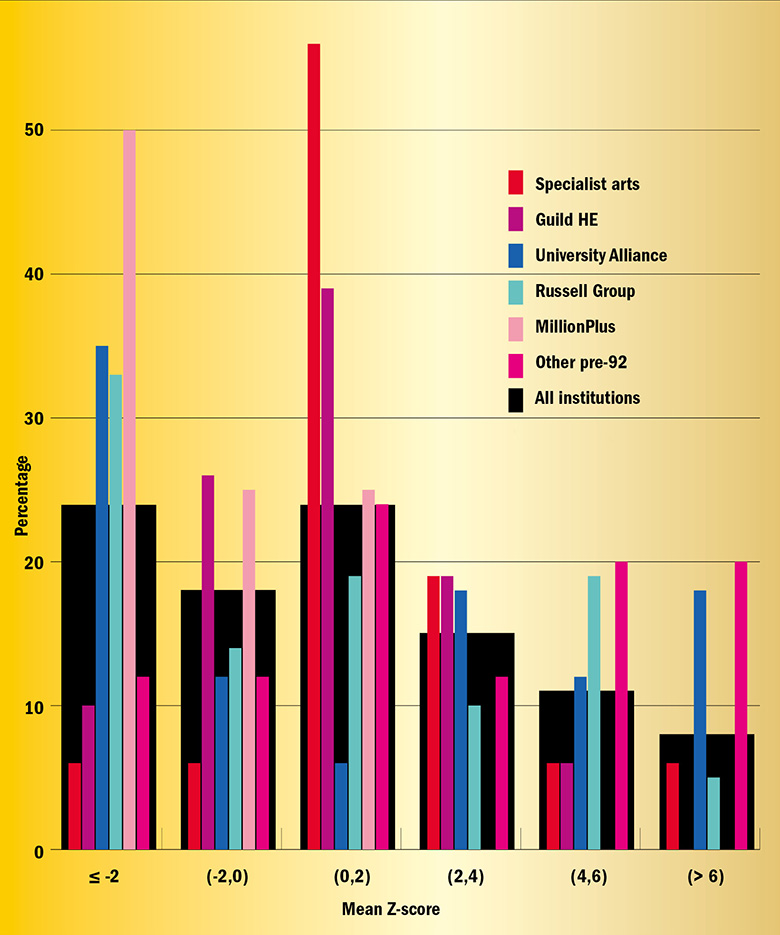
Note: Some institutions appear in both GuildHE and another group
So what other factors were examined after the assessment on the core metrics? Before written submissions, the assessors looked at “split metrics”, which show an institution’s performance against benchmarks, on each metric, for various different groups of students. If a university was significantly far above its benchmark in key areas related to widening participation, such as minority ethnic or disadvantaged students – then it might have lent weight to any argument to bump up the institution’s award, especially if was on the borders of gold/silver or silver/bronze.
However, because of the smaller student numbers involved in split metrics, and the fact that there is less chance of scoring a significance flag, it is arguably unlikely that such considerations would have moved an institution’s position much on their own, unless they told an opposite story to the core findings. Experts on the TEF suggest that the written submissions, which were considered once an assessment of the core and split metrics was complete, were much more likely to have had an impact.
An interesting case study is Imperial College London. Based on the core metrics, it would have been deemed a silver: it performed very significantly above the benchmark on one metric – the number of graduates going into highly skilled employment – but had average scores on four of the other metrics and was below par on one. Its split metrics do not really tell a different story: again, most of its flags for different student groups seem to come in the highly skilled employment category.
However, assessors decided that it should move up a level to gold, presumably on the strength of its narrative submission. The TEF panel’s “statement of findings” for Imperial highlights evidence of “an exceptionally stimulating and stretching academic, vocational and professional education that successfully challenges students to achieve their full potential”.
Compare this with the London School of Economics, another world-leading London-based research-led institution. It too scored a double positive flag on the highly skilled employment metric, but three of its other metrics were very significantly below benchmark, and another was one level below par. This means although there is an acknowledgement from assessors that its submission “partially addressed this pattern of performance”, there is simply too much ground to make up.
The important role that submissions played in the final scores is sure to rekindle a debate that already rages in relation to the research excellence framework: should the TEF slant more towards the metrics in future, or is the balance between data and qualitative statements the fairest approach?
According to Husbands, when initial discussions started between the government and universities over the design of the exercise, “there was clear feedback that metrics should not be used in isolation. Just as there is a campaign for ‘responsible metrics’ in research, it was argued that student outcomes metrics should be contextualised and supported by qualitative evidence.”
He says “it was clear” by the time the TEF was officially consulted on “that the breadth of criteria identified for decisions could not be addressed by the metrics alone”. Husbands points out that as well as consideration of the submissions, a final stage was followed by assessors, in which a “holistic” judgement was made, weighing up all the evidence and assessing a university’s agreed rating against pre-written “descriptor” statements of what gold-, silver- and bronze-level institutions should look like. The assessors’ recommendations were then reviewed by the TEF panel, made up of academics, students, employers and widening-participation experts.
Given that the assessors diligently followed this three-stage process (metrics, submissions and holistic overview), “we should not be surprised…that there is some movement from the initial hypothesis”, says Husbands.
A spokesman for the Russell Group, meanwhile, emphasises that “there are elements of the university learning experience that do not fit neatly into a TEF box”.
“We knew that outcomes would reflect both the metrics and the provider submissions, and that is what we have seen. Our concerns over the TEF process are pretty well documented, but we don’t doubt that Chris Husbands and his independent panel took their responsibilities seriously when it came to provider submissions.”
NSS, REF and TEF scores
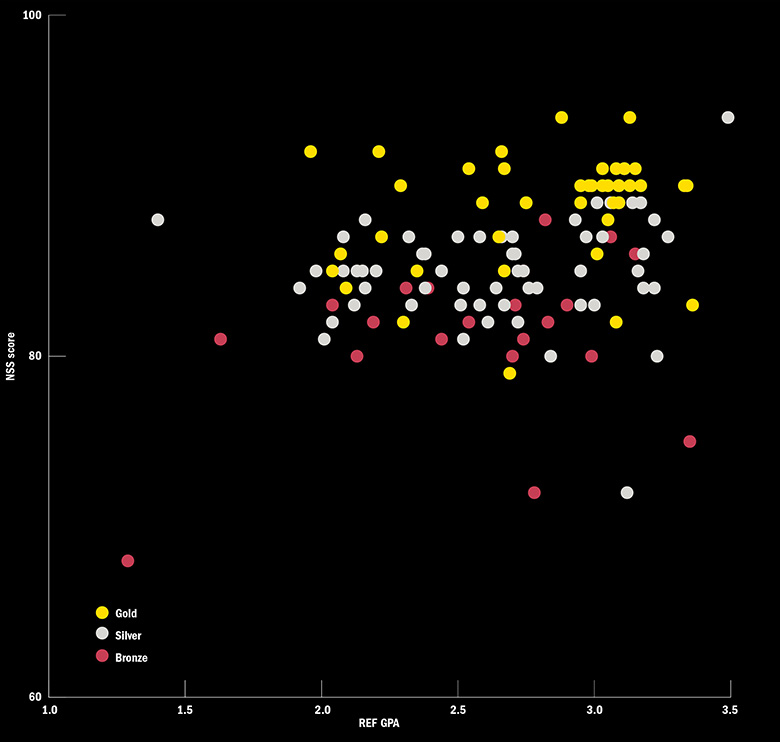
This graph shows the 2016 National Student Survey overall “satisfaction” scores and the 2014 research excellence framework scores for every higher education institution entered in the teaching excellence framework, with the colour of the dot denoting the institution’s final award.
It suggests that gold universities did tend to be those that did well in the NSS, despite the TEF guidance emphasising that assessors “should not overweight information” from the survey, which provided half of the six TEF metrics.
For the REF, gold universities do tend to be those that have a high grade-point average, although there does not seem to be such a difference between silver and bronze.
However, others point out that the clear influence of submissions could lead to problems for the TEF in the future as universities wanting to improve their performance will closely scrutinise the written evidence of institutions that appeared to move up an award in a bid to replicate their success.
Hillman says that it is important that the TEF has a qualitative element, but the fact that there was no precedent for the written submissions means that the tendency for “game-playing” by some institutions will need to be borne in mind for future iterations of the exercise.
He says that in order to minimise the impact of game-playing, the TEF’s architects could borrow a trick from the REF’s book and make every round “in some way different from the previous round” – although the TEF’s planned annual repetition could make that hard to sustain.
However, he adds: “I don’t personally think that institutions moving [award] throws doubt on the process because I think that having the qualitative element…is quite important and this shows that [it] is working.”
Alan Palmer, head of policy and research for the MillionPlus group of modern universities, says that the lack of precedent for the submissions could have been addressed if the TEF had been piloted. However, the “political desire to move quickly” into implementation meant that this was not possible.
“Submissions were always going to play an important role, but without any pilots there was no opportunity for lessons to be learned either by universities or assessment panels. The reality is that the government has been very willing to sail higher education into uncharted waters, including in respect of the TEF, with insufficient regard for the consequences for universities and students,” Palmer says.
However, Husbands says that there was “a deliberate decision not to prescribe the format of the submissions, on the basis that this could work contrary to our desire to embrace the full range of approaches to learning and teaching across a highly diverse group of institutions”. And he points out that there was a technical consultation on the exercise, “so the sector had a chance to suggest an alternative approach”. While he accepts that “no doubt there will now be a great deal of scrutiny of the submissions”, he is “clear that this will be beneficial to all involved”.
Hillman says that another ongoing challenge for the TEF will be to win public acceptance of its results, and to successfully convey that very different types of university can be awarded the same grade on the basis of their performance against their own benchmarks in the metrics.
He raises the example of the University of Southampton and Southampton Solent University, which both got bronze awards despite their having very different missions and reputations. “The bit that is hardest to describe and explain to people who just want a simple measure of British university quality is the benchmarking aspect,” he says. While “it is not an impossible thing to explain” given that like-for-like comparisons of consumer products are made all the time, it will be a challenge.
One future idea might be the ditching of the simple three-band system of medals – whose adoption Hillman attributes to the fact that 2016 Rio Olympic Games were on television when civil servants were devising aspects of the TEF – in favour of a more granular approach. But although Hillman says the medals “are a bit gimmicky”, it is inevitable, in his view, that “whatever grading system you choose”, it is “going to leave some people unhappy”.
It is certainly true to say that some universities will be feeling unhappy after last week’s results. The key question is how will they react. Will they dismiss their score as the aberrant upshot of a fundamentally flawed exercise? Will they focus on doing what they can to get it overturned? Will they cynically seek to game the system next time around by, say, axing courses with high dropout rates or poor student outcomes? Or will they take their result as a genuine sign that they must seek to improve their teaching and student focus, and act accordingly? On these issues, ultimately, the TEF’s success will be judged.
Video: beyond the medals table
Data editor, Simon Baker, on the methodology and reasoning behind this TEF analysis.
Guide: flag signals
In each metric (teaching on my course, assessment and feedback, academic support, non-continuation, graduate employment or further study and highly skilled employment or further study), institutions were given a flag if they performed significantly well or badly (in a statistical sense) compared with a benchmark value.
An institution could have achieved one of five different flags in each metric: ++ (if they performed particularly well against the benchmark), + (if they performed well), = (if there was no statistically significant difference from the benchmark), − (if they performed badly against the benchmark) and − − (if they performed particularly badly).
Times Higher Education counted the number of times an institution achieved a flag in each category (six being the maximum) and then sorted the final table according to TEF award, then flag performance and finally by average Z-score across the six metrics. A Z-score is a numerical value that expresses how far the institution deviated from the benchmark in a particular metric.
Who were the movers?
Thanks to work by THE data scientist Billy Wong, the analysis also means it is easy to identify which institutions would have been given an initial TEF assessment, based on the core metrics, that was different from the final outcome.
According to the official TEF guidance document, “when looking at the delivery mode in which providers teach the most students”, an institution “with three or more positive flags (either + or ++) and no negative flags (either − or − −) should be considered initially as Gold” while an institution “with two or more negative flags should be considered initially as Bronze, regardless of the number of positive flags”. All other institutions were to be initially considered silver.

Lifted by the tale: the impact of narrative statements
How did some universities with mixed metrics scores get bumped up to a silver or even a gold rating in the teaching excellence framework?
The answers are in the 15-page narrative statements submitted by each institution: these were “critical” to the final standings, says Chris Husbands, the TEF chair. Indeed, many vice-chancellors have been surprised by how much importance the assessment panel gave to the submissions, having understood the exercise to be a largely metrics-driven affair.
According to Husbands, universities were rewarded when their statements demonstrated a genuine commitment to student engagement and exhibited an understanding of the needs of different student groups.
The Royal Veterinary College’s statement is particularly instructive as it was the only higher education institution to gain a gold award when its raw metrics suggested that it merited bronze, according to analysis by Times Higher Education.
The TEF panel’s statement of findings flags up graduate employment metrics that are “notably below benchmark”, in contrast to high student satisfaction scores. But in its defence, the institution points out that since it is a small institution, its results are “easily distorted by exceptional circumstances”. And it explains that in a cohort of 226 students, one student died and eight went off on a “travelling tour” after their studies, affecting data on graduate employment.
The TEF panel appears to have accepted these arguments, noting in its statement of findings that the adverse metrics have been “fully and exceptionally addressed by the provider submission”. Some, however, may wonder whether small providers enjoyed an unfair advantage when it came to their ability to explain away bad results. Could a university with a graduating class of 10,000 ever describe the holiday plans of their graduates in such minute detail?
That said, some notably large institutions have also had their awards bumped up on the basis of their submissions. One was Imperial College London, which was lifted from a silver to a gold award. According to the TEF panel, Imperial’s student satisfaction scores for assessment and feedback were “currently below benchmark”, but this problem area was an “acknowledged priority for the provider” – an apparent nod to the institution’s description of a new framework to deliver student feedback more swiftly. However, other institutions rated silver or bronze may wonder why their appeals for leniency in problem areas were not always acknowledged to the same degree.
Only one institution – Bucks New University – saw its TEF rating fall after its submission was assessed. According to THE ’s analysis, it would have gained silver on metrics alone, yet it emerged with bronze.
Despite being praised for “metrics [that] indicate…generally high quality provision”, its TEF statement points to “student outcomes [that] are notably below benchmark” regarding graduate employment. The institution’s lengthy explication of some of the explanatory factors – such as the existence of the 11-plus exam in Buckinghamshire and the demoralising effect it has on many students later in life – does not seem to have swayed the panel.
Other similarly geography-specific reasons for underperformance – such as the high cost of living cited by some London institutions as a factor in higher dropout rates – do not seem to have convinced assessors either.
Knowing which type of special pleading works and which does not is likely to become something of a niche industry in the years ahead, so expect many more analyses to come.
Jack Grove
|
Institution (award on metrics → final award) |
What the institution said |
What the TEF panel said |
|
Bucks New University Silver → Bronze |
“In Buckinghamshire, selective grammar schools are extremely unlikely to recommend attendance at the local university, and our outreach work indicates that the experience of not having been selected for grammar schools at age 11 impacts the confidence of pupils in the non-selective schools, a factor not captured in other contextual or benchmarking factors. Careers interviews with third-year students identify the impact of this on graduate destinations and appear to be reflected in a lack of confidence to apply for highly skilled graduate jobs.” |
“Metrics indicate that the university delivers generally high quality provision, but that student outcomes are notably below benchmark…concerning highly skilled employment or further study. Metrics indicate that most students receive a high quality education from a provider with a developing culture of teaching excellence, although student satisfaction with the quality of the teaching is below benchmark for several student groups.” |
|
Silver → Gold |
“Whilst sustained improvement has been achieved in the highly skilled destinations of full-time, first degree graduates…[we] have made accelerated improvements in highly skilled destinations for full-time degree graduates our number one strategic priority.” |
“The metrics indicate outstanding levels of satisfaction with academic support. The university is below benchmark for highly skilled employment; however, the panel deemed this was partially addressed by the provider submission.” |
|
Silver → Gold |
“The College recognises that effective and timely feedback is an important part of its educational provision, and that a fall in student satisfaction in this area requires priority attention…The college has now agreed new policies on penalties to be applied for late submission of work (since students wanted consistency across the College) and a new framework for the provision of feedback, which takes into account the need for feedback to be both timely and effective and, above all, for there to be greater transparency around the expected timescales.” |
“The provider metrics, supplemented by the provider submission, indicate that students from all backgrounds achieve outstanding outcomes, in particular with regard to progression to highly skilled employment or further study…Student satisfaction with assessment and feedback is currently below benchmark, and this is an acknowledged priority for the provider.” |
|
Bronze → Bronze |
“Improvement [on feedback scores] is a result of a series of initiatives across the university focused on enhancing assessment design and student feedback: ensuring feedback is delivered to students within 15 working days, focusing on the quality of that feedback and articulating how it can improve future work.” |
“Student satisfaction with teaching, academic support, and assessment and feedback is below the provider’s benchmark for some student groups. The Panel deemed that below benchmark performance was partially addressed by the provider submission.” |
|
Bronze → Gold |
“Our student numbers and particularly our graduating cohorts in any one year are relatively small. Related data are therefore easily distorted by exceptional circumstances; the irregular behaviour of a few students can significantly affect the difference between [the] indicator and benchmark…this small population means we are often able to clarify the qualitative information ‘underneath’ the metrics, and explain the data in the context of teaching excellence.” |
“Although the outcome for students for progression to higher skilled employment or further study was notably below benchmark, this was fully and exceptionally addressed by the provider submission. The metrics indicate high levels of student satisfaction for teaching on my course, which was notably above benchmark. |
|
Bronze → Bronze |
We recognise that our overall position on student satisfaction with assessment and feedback should be better…Good student progression rates, outcomes and employment/progression to further study suggest that our assessment and feedback practices are not fundamentally flawed, but student responses as measured by the NSS…clearly indicate that at the very least we are not adequately engaging with our students on this aspect of their academic experience. All of the work that we have put into this area over recent years has therefore included a focus on student engagement.” |
“Retention is at levels notably exceeding the provider’s benchmark. However, the metrics indicate that satisfaction with teaching, academic support, and assessment and feedback are below the provider’s benchmark.” |
POSTSCRIPT:
Print headline: Mysterious alchemy
Register to continue
Why register?
- Registration is free and only takes a moment
- Once registered, you can read 3 articles a month
- Sign up for our newsletter
Subscribe
Or subscribe for unlimited access to:
- Unlimited access to news, views, insights & reviews
- Digital editions
- Digital access to THE’s university and college rankings analysis
Already registered or a current subscriber? Login
")


