
The ongoing row about vice-chancellor pay hit another peak this week as the under-fire head of the University of Bath Dame Glynis Breakwell narrowly survived a vote of no confidence by the institution’s senate.
That was followed by comments from the incoming chair of the new Office for Students (OfS), Sir Michael Barber, on 24 November that the regulator may publish the ratios of vice-chancellor pay to that of other staff in a bid to tackle the issue.
Fortunately, though, we do not have to wait for the OfS to become fully operational in April to see such ratios: data from Times Higher Education’s own examination of vice-chancellor and staff pay in 2015-16 show how these vary across the sector.
As the vice-chancellor figures published in June by THE, in association with Grant Thornton, showed, Dame Glynis was not only the highest earning university leader in 2015-16, she also had the biggest ratio of v-c salary to average academic pay at 8.7.
The embattled head of Bath is also at the top of the tree if total salary and benefits (excluding pension contributions) for that year are compared with average academic salaries (ratio of 9) and the average pay of all staff at institutions (ratio of 11.9). The median ratios in the sector are 5.2 for academic staff and 6.3 for all staff.
Vice-chancellor to staff pay ratios at UK universities in 2015-16
Search by university and vice-chancellor or toggle columns to order them
Source: Hesa/Grant Thornton.
Notes: V-cs were those in post during 2015-16. Universities with more than one v-c employed during the year excluded. ‡ Patrick Johnston died on 4 June this year.
Bath is certainly not the only institution with pay ratios that seem to exceed the average by some distance: at the University of Sheffield, Sir Keith Burnett’s salary and benefits were 10.9 times the average pay of all staff and 8.8 times that of academics; Sir David Eastwood at the University of Birmingham is third in the list on both measures (ratio of 10.8 for all staff and 8.5 for academics).
But has this gulf between staff and vice-chancellor pay at some of these institutions been a recent phenomenon or has it increased in recent years?
A full comparison of every institution in the UK is difficult because vice-chancellors sometimes move roles within an academic year leading to overlaps in the salary data (for the table above universities with these overlaps were excluded).
However, a focus on the vice-chancellors with the highest ratios to average academic pay in 2015-16 – who also held the same post in 2010-11 – gives a flavour of how some of these ratios have changed over time.
Taking 10 vice-chancellors with the highest pay ratios in 2015-16, who were also in the same post in 2010-11, shows that there has been a clear upward drift, with the pay gap at Bath being one of the biggest risers.
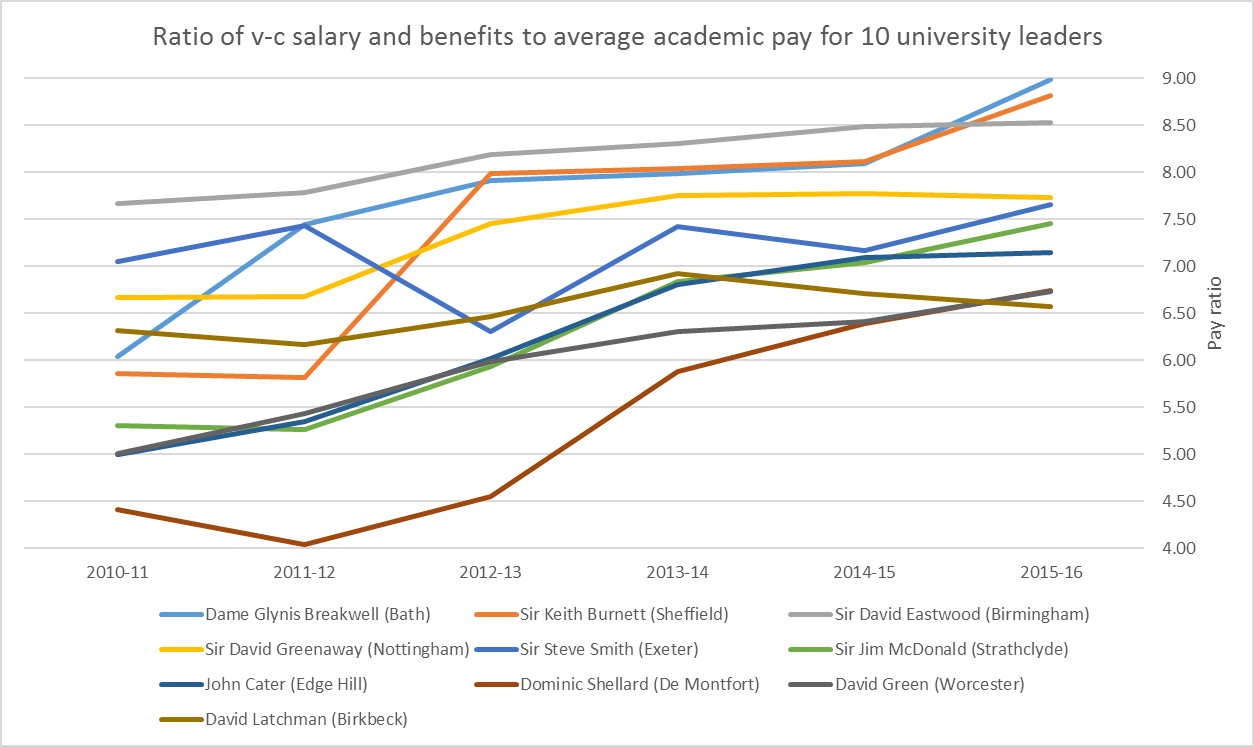
But in percentage terms the ratio at Bath did not see the biggest growth out of these 10 institutions. That was at De Montfort University where the gap between Dominic Shellard’s salary and benefits and average academic pay went up 53 per cent over the period from a ratio of 4.4 in 2010-11 to 6.7 in 2015-16. The pay ratio at Sheffield also went up by more than 50 per cent; it was 5.9 per cent in 2010-11.
At some other institutions, the pay ratio appears to have been more stable over the time frame. Examples among these 10 include Birkbeck, University of London, where the ratio between David Latchman’s pay and benefits and the average academic salary has hovered between 6 and 7.
Of course, for full transparency, ratios would need to be explored for every institution going back over these years – there may well be other universities where ratios have climbed higher than these. There may also be explanations for the general uplift: for instance, in recent years some vice-chancellors have been awarded higher salary and benefits sums because they were no longer topping up pensions.
But this snapshot certainly suggests that the gap between leaders’ and academics’ pay has been widening, for whatever reason.
Find out more about THE DataPoints
THE DataPoints is designed with the forward-looking and growth-minded institution in view
Register to continue
Why register?
- Registration is free and only takes a moment
- Once registered, you can read 3 articles a month
- Sign up for our newsletter
Subscribe
Or subscribe for unlimited access to:
- Unlimited access to news, views, insights & reviews
- Digital editions
- Digital access to THE’s university and college rankings analysis
Already registered or a current subscriber? Login


