
This new Times Higher Education data analysis was presented at a masterclass of university leaders in Davos on 19 January 2017.
Although we tend to look at individual universities in the Times Higher Education World University Rankings, sometimes it can be interesting to look at education systems as a whole – or at least at country performance.
One way that we can do this is to plot gross domestic product (GDP) per capita for each country against the average World University Rankings score of the ranked universities in that country.
Here's what it looks like.
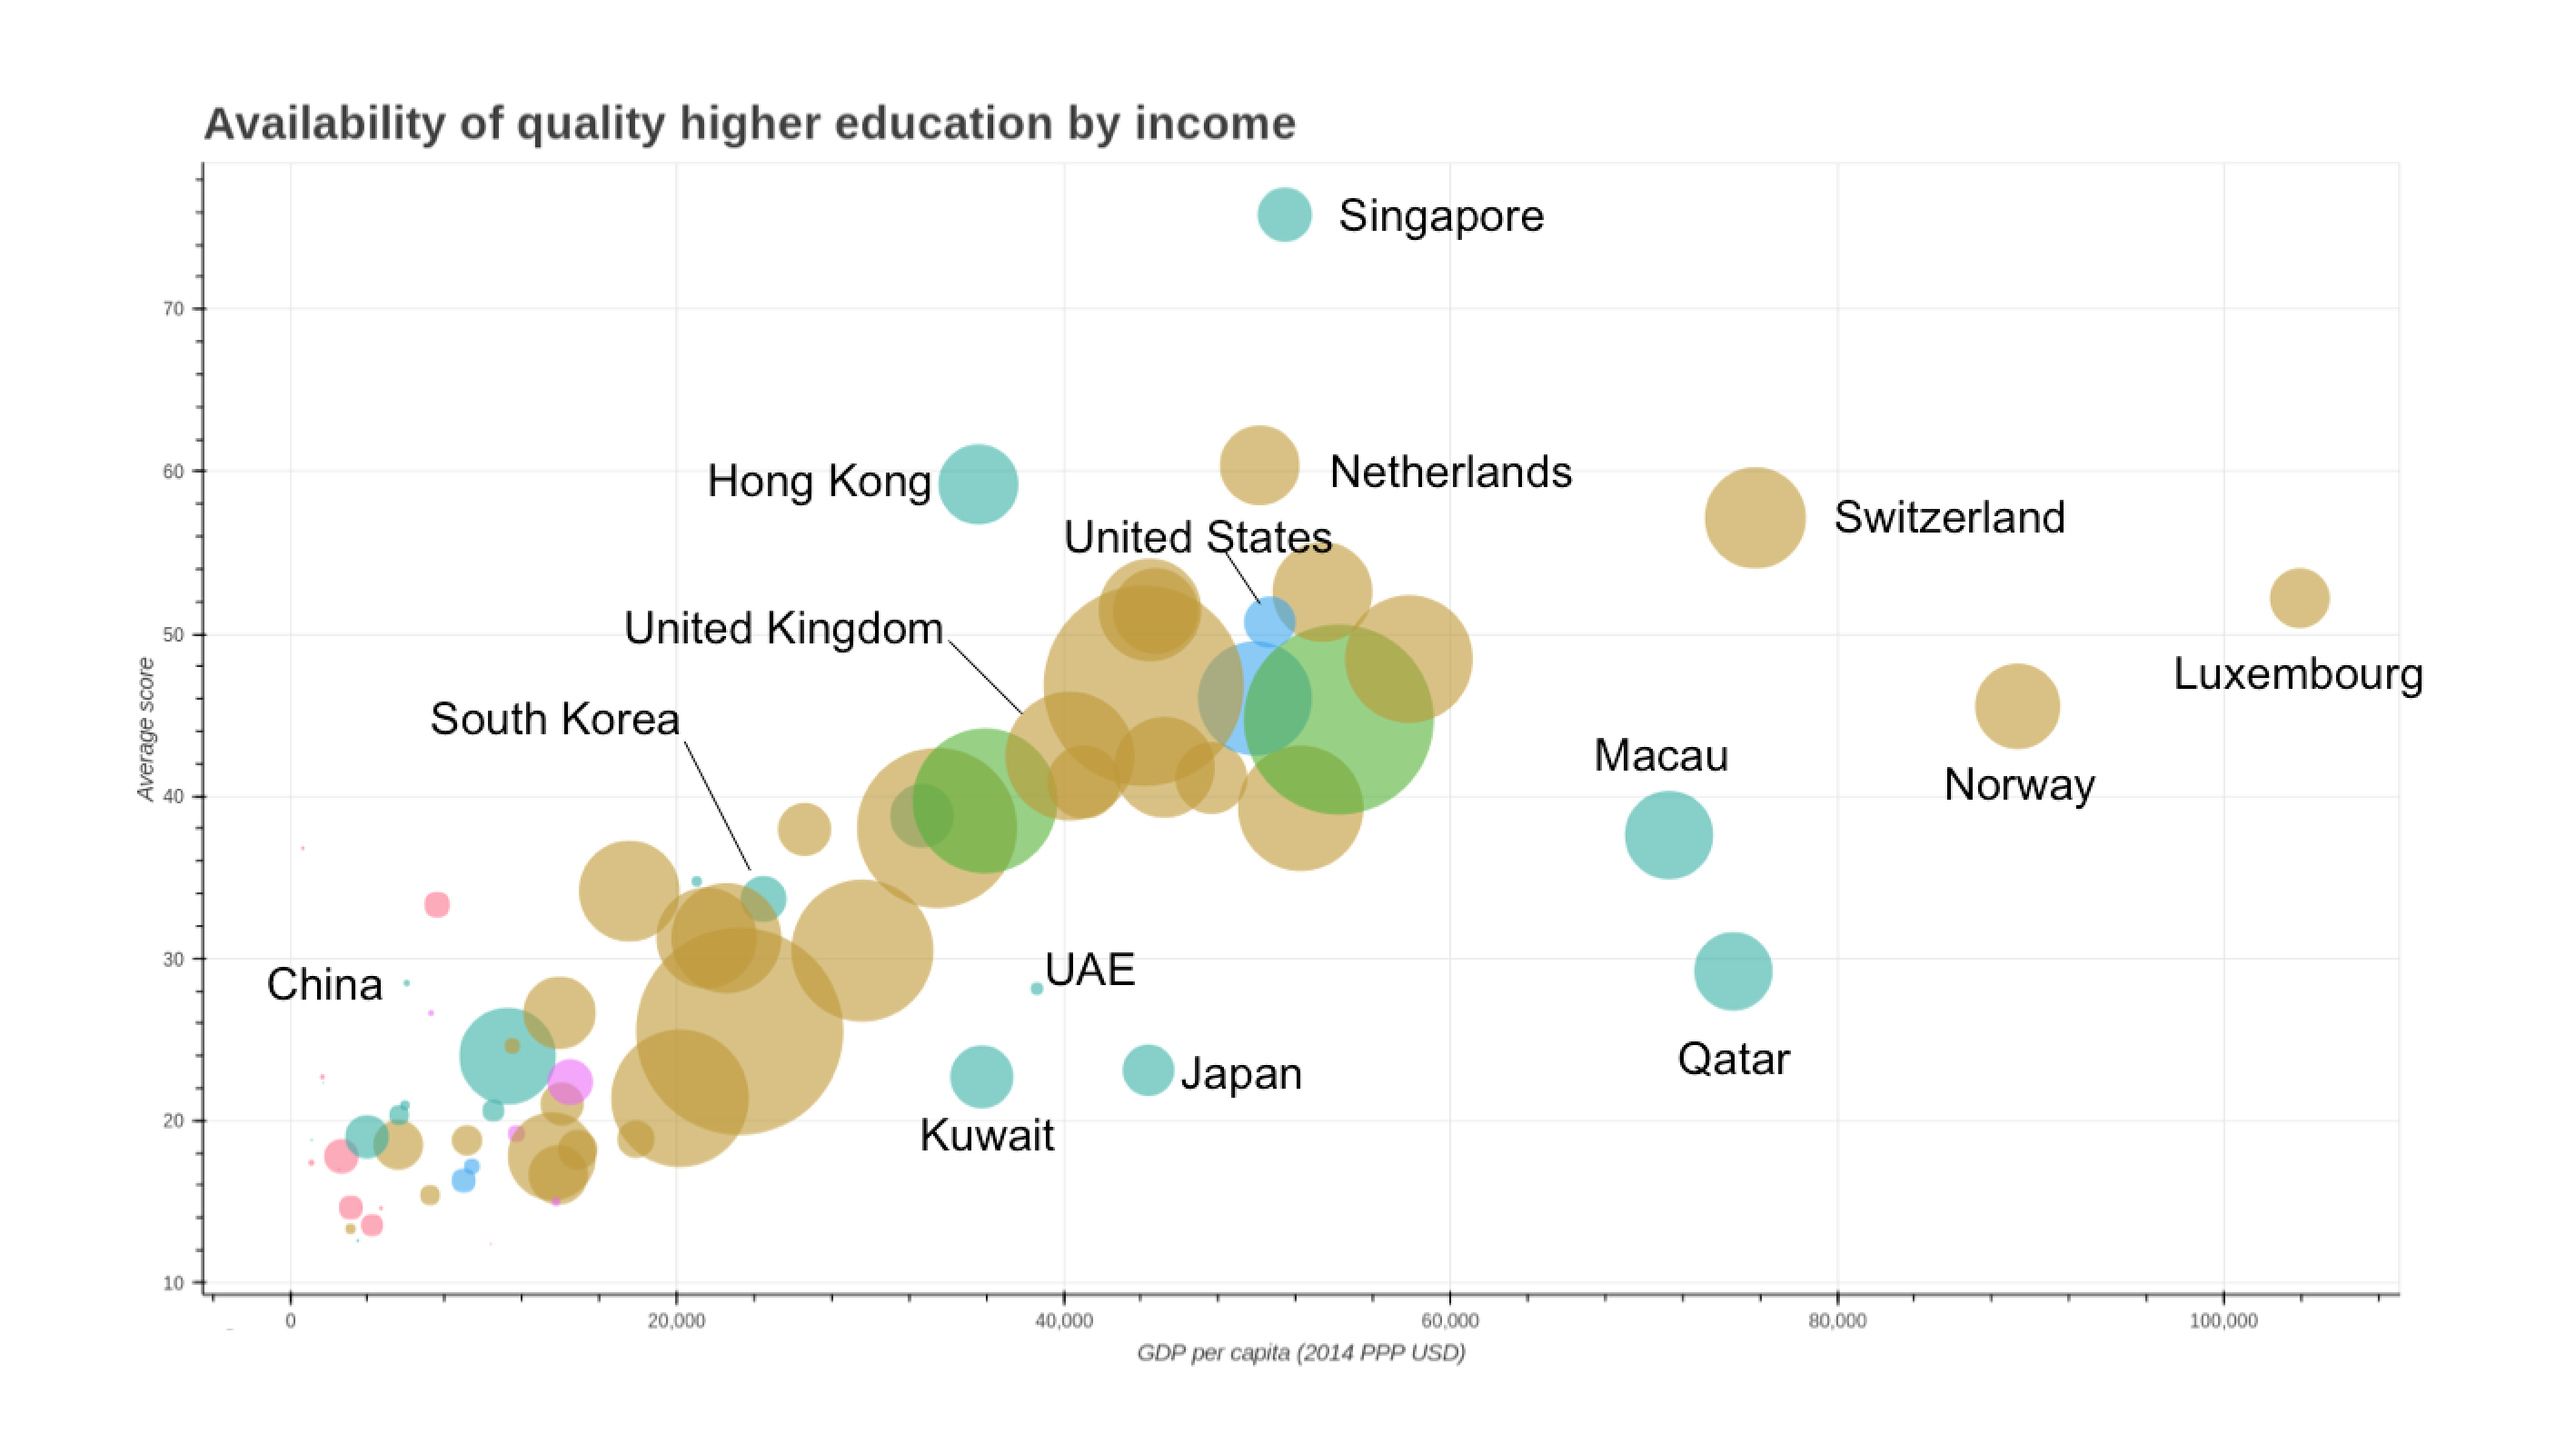
Now, of course, there are some caveats. As always, we are looking at research focused universities. There are also a few edge effects (Luxembourg has only one university), and for countries other than the UK we don’t necessarily have data for all the universities.
Given that, what can we see? Well, the first thing that is noticeable is the main sequence of countries. Within the main sequence there is a fairly straightforward relationship between GDP and score: the higher your GDP, the higher your average score.
But oddly this strong correlation seems to fade by the time you hit a GDP of $40,000 (£32,500).
Next, we have the dwarf stars, Kuwait, Japan, the United Arab Emirates and Qatar, all of which seem to underperform compared to what we would expect based solely on GDP.
On the other hand we have the giants, Hong Kong and the Netherlands, and the super giant, Singapore. All are doing far better than their GDP alone would suggest.
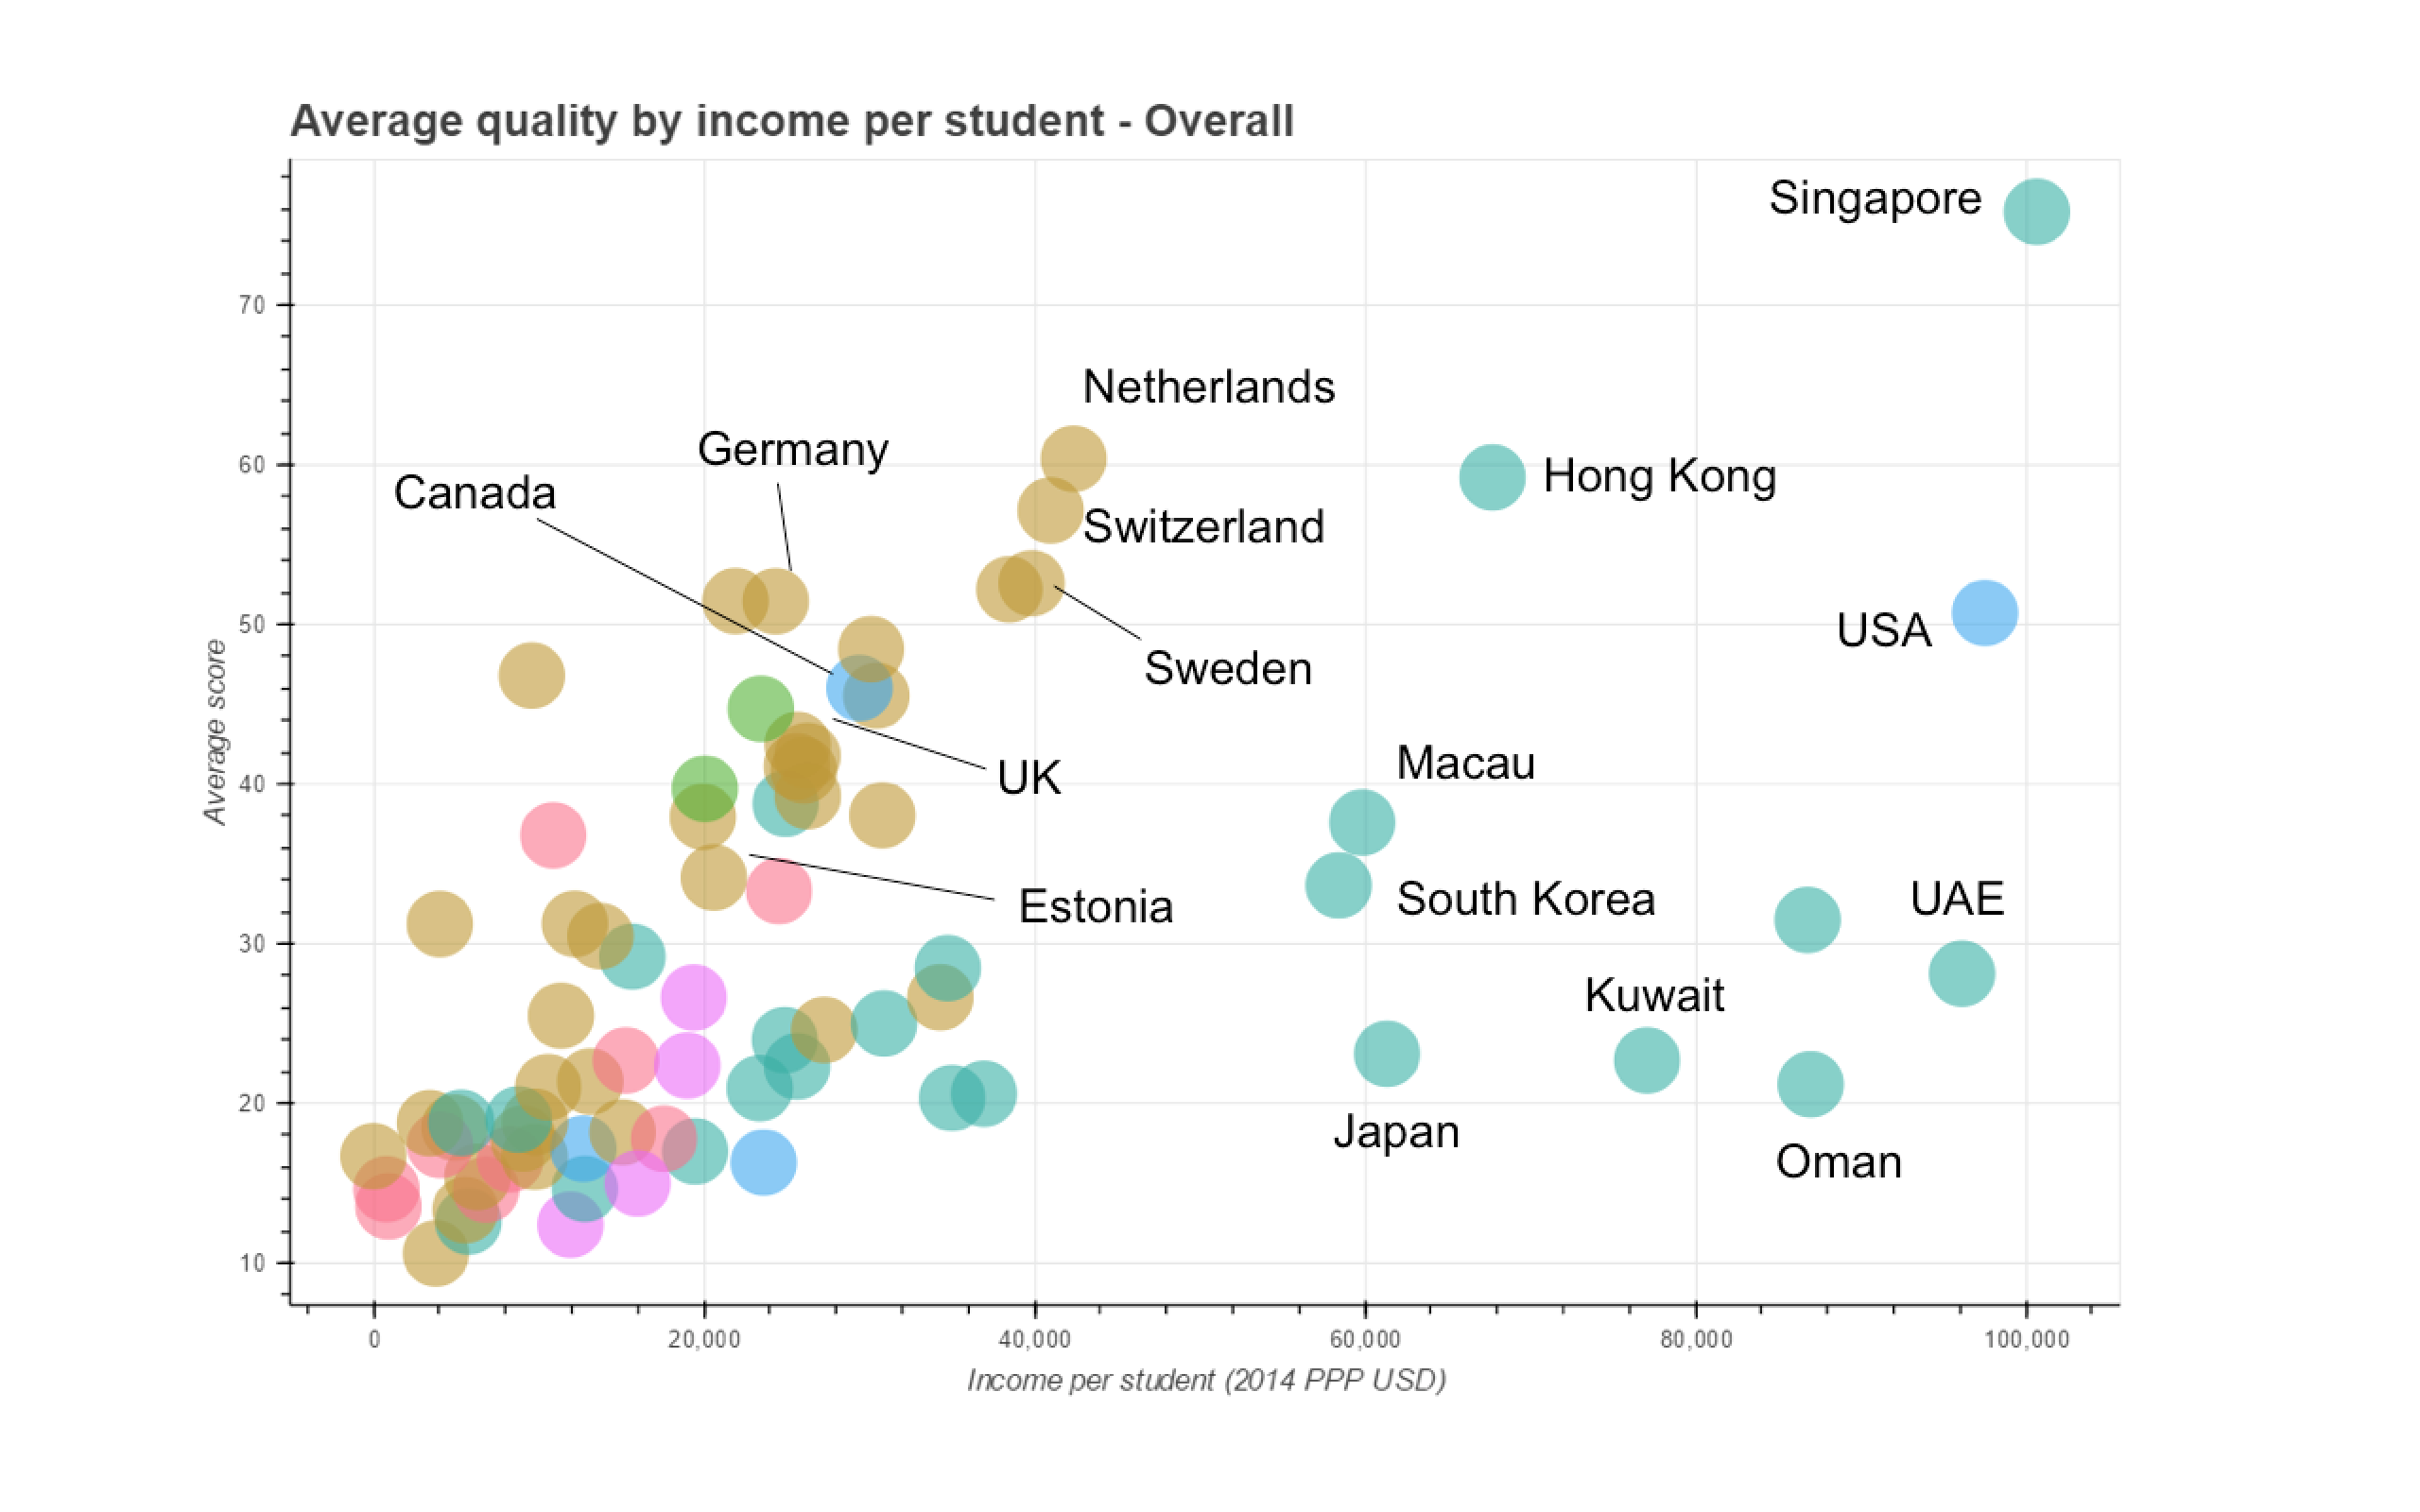
If we dig a bit deeper we start to see why this might be the case. Here we look at the amount of money spent on universities per student, rather than simply the GDP of the country.
Again, there seems to be a general trend (those that spend more have stronger universities), but there are a number of interesting points.
- Gulf states: here we see high expenditure for relatively low scores. But this is also associated with rapidly growing systems. The universities are typically younger, and are spending to significantly improve their results.
- Europe: nowhere is the linear relationship between spending and performance more obvious. It’s also interesting that the varied selection and funding approaches don’t seem to be as important as the overall funding. Once more, the Netherlands is the star performer.
- Singapore is clearly investing hugely in its star universities (and this is true regardless of the subject we look at).
- Japan is probably being affected by its declining student population.
- The US’ and Canada’s systems are so similar in many ways. But can the hugely higher spending in the US be justified by its modestly better performance?
Another interesting thing we can pick up from the initial plot (and why, incidentally it is titled “availability of quality higher education”) is the proportion of university aged people attending universities that are in the World University Rankings. The larger the circle, the higher the proportion.
Again, some care needs to be taken: not every university is represented in the rankings. Specifically, the ranking looks at research focused universities.
However, it does give some clues about the approach to higher education in different countries. We can start to see the different focus taken by different countries (investing in elite universities, or broadening access to education) at least in their top research universities.
The most notable aspect of this is that western European countries lead the way in educating the highest proportion of their students at research focused institutions. Of course, whether or not this is a good strategy is another matter.
Duncan Ross is the director of data and analytics at Times Higher Education.


