A large drop in the number of students coming to the UK of 41,000 was the major factor accounting for net migration falling to its lowest level since 2014, new data show.
Net migration statistics published by the Office for National Statistics on 23 February showed that long-term immigration to study saw a “statistically significant” fall of 23 per cent to 134,000 in the year to the end of September 2016. This is the lowest estimate recorded since 2002.
The majority of this drop occurred in the cohort of students from outside the European Union (31,000 out of the total of 41,000, or 76 per cent).
Of the estimated 87,000 students who came to the UK to study from outside the EU in the year to September 2016, citizens of Asian countries made up 68 per cent (59,000) of the total, a fall of 23,000 from 82,000 the previous year.
However, the same ONS release also highlighted that the number of visas issued over the same period to non-EU students for 12 months or more was up 2 per cent.
The ONS said such an apparent anomaly in the figures was not “unprecedented” and could be down to the timing difference between visas being issued and students travelling, length of stay as well as “sampling variability and the fact that a visa may not be used”.
Meanwhile, the importance of Chinese students to UK higher education was again highlighted by the ONS figures.

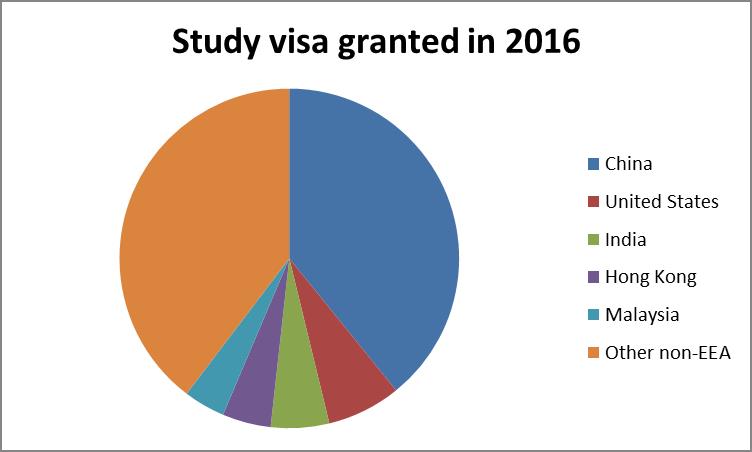
Chinese students represented almost the same proportion (39 per cent) of all main applicant study visas that were issued in 2016 as all other non-EU countries, once the US, India, Hong Kong and Malaysia are excluded (see above).
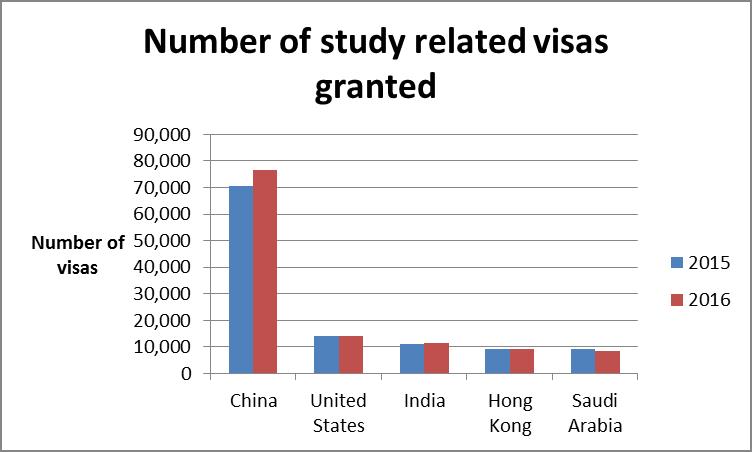
A separate Home Office report also showed that China was the only country where there was real growth in the number of visas issued to study (see below) last year.

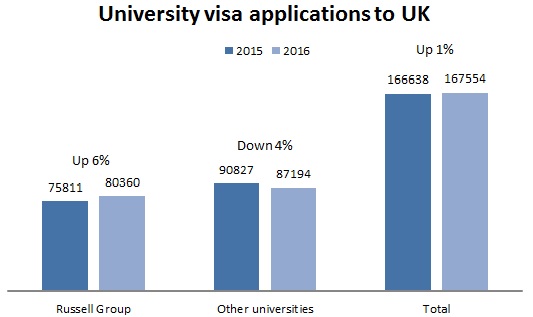
On visa applications, 2016 saw the total from non-EU main applicants fall by less than 1 per cent to 200,849. Most interestingly, this included a rise for higher education of 1 per cent and within this total, applications from Russell Group universities rose by 6 per cent. However, for other universities visa applications fell 4 per cent in 2016.
This will raise fears that the UK government’s approach to concentrate its visa policy on the “brightest and best” is now showing clear signs of taking effect.

Figures obtained by Times Higher Education and published separately on 23 February showed how it is “lower-ranked” universities that have been hit the hardest by falls in non-EU students in recent years.
Register to continue
Why register?
- Registration is free and only takes a moment
- Once registered, you can read 3 articles a month
- Sign up for our newsletter
Subscribe
Or subscribe for unlimited access to:
- Unlimited access to news, views, insights & reviews
- Digital editions
- Digital access to THE’s university and college rankings analysis
Already registered or a current subscriber? Login


