
The latest results for the Times Higher Education Student Experience Survey have seen some familiar institutions vie for the top spots. But further down the list, which universities – in the eyes of students – have really improved over the past decade, even if such institutions have not been claiming the headlines?
In-depth data from YouthSight, which compiles the survey, have allowed THE to dig deeper on the scores that underlie the overall performance of universities to reveal which ones have been making the most progress and which have been slipping back. The statistics also indicate those aspects of the student experience that have most influenced these changes.
The data provide universities’ indexed scores in each of the 22 questions that underpin the overall results averaged across three years of the survey. This three-year average – which provides more robust results, owing to the larger sample size of student interviews – can then be rolled back as far as 2009 to analyse how scores have changed over time. Comparing these three-year rolling averages from 2009 to 2018 reveals the institutions that have moved the most.
More on the 2018 Student Experience Survey
Student Experience Survey 2018: the results
Student Experience Survey 2018: methodology
Student Experience Survey 2018: Higher education sector still raises the bar in a turbulent year
Student Experience Survey 2018: Protecting free speech while keeping students safe
Student Experience Survey 2018: Loughborough says its students’ ‘get-up-and-go’ attitude is the key to its success
Student Experience Survey 2018: Staffordshire’s 24-hour campus that works for all
Student Experience Survey 2018: Keeping mental health in mind
Student Experience Survey 2018: ‘At over £9K a year, is a degree worth it?’
For instance, the University of East London has seen its three-year average on the overall indexed score jump almost 15 points in that time period – several points higher than any other university. Other London-based institutions such as Middlesex University and the University of Westminster have also been big movers.
It is worth noting that they are all universities still in the bottom fifth of the table and so, statistically, they have much more opportunity to move up. However, compared with the 2009-11 averaged results – when they were all among the bottom four universities – they have covered impressive ground up the table, especially given that London institutions tend to perform worse on student experience. For example, East London’s indexed ranking (where every institution is ranked from 1 to 100) from 2009 to 2011 was 100 but by 2016-18 it had risen to 89.
Westminster and East London are also institutions that were near the bottom of THE’s teaching excellence framework league table, having both received bronze awards and some of the lowest combined metric scores in the exercise. But these TEF assessments were based on data going back several years, so they may hope that the SES improvements indicate they could fare better in future TEFs.
Others among the top 10 highest movers have made an impressive impact higher up the overall table. For example, Queen’s University Belfast, which, based on the three-year average data had an indexed ranking of 53 overall in 2009-11, is now 12th in the latest set of data. Coventry University, a star performer in the TEF, has jumped more than 40 places to an indexed ranking of 38th in the latest three-year list.
High-weighted questions*: top universities
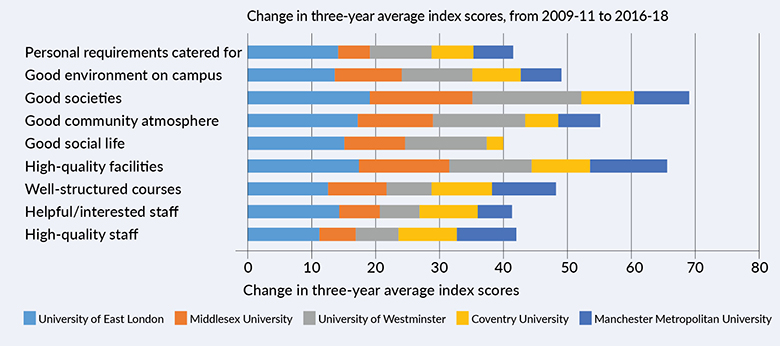
*Questions given the heaviest weight of 2 in our mean score of each of the 21 formulated measures
But do the underlying data suggest in which areas of the student experience these institutions have successfully improved in order to make such inroads? One way to dig deeper is to examine the “composite” scores representing seven different areas of the student experience covered by the survey. Taking the five universities whose average three-year results rose the most, and looking at the changes in their composite scores, suggests that, generally, their performance in “societal experience”, which includes scores on an institution’s social life and community atmosphere, and “university facilities” improved the most.
However, it is not the same for every university: Coventry, for example, improved more in “academic experience” compared with the other areas and actually saw a bigger rise in this score than any of the other institutions except East London.
It is also important to bear in mind that the composite areas will have completely different impacts on the overall score depending on how many survey questions they cover and the weighting given to those questions. For instance, academic experience covers six separate questions, three of which have a double weighting when the overall score is calculated, while good accommodation covers just one question, weighted 1.5 in the final calculation. This suggests that a strong performance in academic experience, university facilities and societal experience are what have mostly propelled these five universities higher in the overall scoring.
In particular, by breaking the changes down even further and looking just at the individual questions that have double weighting, a clear pattern is visible of social factors – such as the presence of good student societies and of high-quality facilities – having a big impact.
East London clearly benefits from this facilities boost the most while it should also be noted that it achieved a huge 41-point lift in its sports facilities score (although this question carries no extra weighting). Recent investments in its campus have included the opening of the £21 million state-of-the-art SportsDock facility, which was used by Team USA for the London 2010 Olympic and Paralympic Games.
Meanwhile, Coventry’s success can be clearly attributed to consistently solid improvements in the three double-weighted questions in the academic sphere: the presence of high-quality staff and lectures, the helpfulness of academics and how well-structured courses are.
These kind of breakdowns become even more interesting when examining the data for the universities that have lost the most ground from 2009 to 2018, although the magnitude of the changes is smaller owing to the student experience scores for every university rising on average over the period.
High-weighted questions: bottom universities
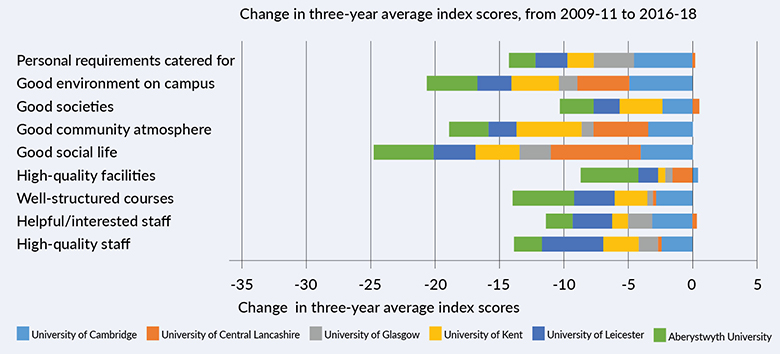
*Questions given the heaviest weight of 2 in our mean score of each of the 21 formulated measures
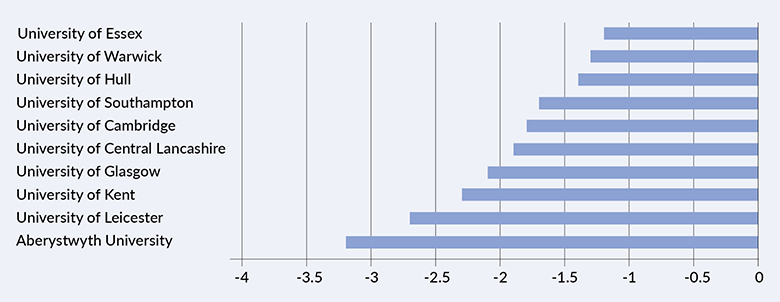
Here, it is Aberystwyth University that has fallen back on its three-year average overall scores the most, by 3.2 points, followed by the universities of Leicester (down 2.7 points) and Kent (down 2.3). Aberystwyth’s fall can also be traced in terms of position: its average indexed ranking was 7 across 2009-11, falling to 32nd for 2016-18 (although relatively strong scores in recent results have moved it from a low point of 50th for 2014-16).
Leicester and Kent have both dropped back consistently over the years. Leicester fell from 14th across 2009-11 to 46th in the latest data, while Kent has dropped 29 indexed places to 59th.
An analysis of the composite scores shows that questions about student accommodation and societal experience affected the five biggest fallers the most. However, the fact that societal experience covers four double-weighted questions indicates that this would have had a far greater impact on the overall results. The University of Central Lancashire, in particular, has taken a notable hit in the societal experience category, which accounts for a large part of its fall, despite seeing no significant change in students’ perceptions of its academic credentials. It is also interesting how Leicester’s overall performance has been influenced by a relatively big change in its scores for academic areas.
Looking at the double-weighted questions from the survey confirms these trends, and highlights how it is perceptions about the availability of “high-quality” staff and lectures that has hit Leicester the hardest while it is social questions about campus life that have predominantly affected Uclan.
Overall, it is very noticeable that, for the institutions seeing the biggest falls in overall score, the societal experience questions have the biggest effect. A key example of this trend for some institutions is the University of Cambridge, which had the sixth biggest fall in the overall three-year average score over the period, sending it from an indexed ranking of 4th in the table across 2009-11 to 15th in the latest data.
Some of the main contributions to this change appear to have been lower ratings for student welfare (specifically, “personal requirements being catered for”) and whether there is a good environment on campus. Interestingly, on student welfare, it was rated the best in the country from 2009 to 2011 but now has an indexed ranking of 26th.
Such results may raise questions about whether concerns over the pressure on students, especially in the light of higher fees, have led to falling scores for societal experience at some universities.
Top 10 fallers in overall average index scores from 2009-11 to 2016-18
Find out more about THE DataPoints
THE DataPoints is designed with the forward-looking and growth-minded institution in view
Register to continue
Why register?
- Registration is free and only takes a moment
- Once registered, you can read 3 articles a month
- Sign up for our newsletter
Subscribe
Or subscribe for unlimited access to:
- Unlimited access to news, views, insights & reviews
- Digital editions
- Digital access to THE’s university and college rankings analysis
Already registered or a current subscriber? Login