
The increasing importance of overseas students to UK universities has been a familiar theme of the country’s higher education landscape in the last 10 to 15 years.
It is the main reason why government policy towards such students is often near the top of the list of items for discussion for lobbying vice-chancellors.
But do overseas students now represent a greater share of income than in Australia, another country where the education export market is high up the agenda?
A look at financial data from Australia’s Department of Education and Training suggests that the UK has a little way to go before it is quite as reliant on overseas students to keep revenue ticking over.
In 2015, fees from overseas students accounted for almost 19 per cent of total revenue for higher education providers in Australia, a figure that has been steadily climbing in recent years. According to Universities Australia, from 2004 to 2014 revenue from overseas students increased in real terms by almost 75 per cent to AUS$4.7 billion (£2.84 billion).
Looking at the latest available figures for the UK from the Higher Education Statistics Agency, overseas student fees as a share of universities’ total revenue, or income, represented a lower share than Australia at 12.8 per cent.
However, this is not the complete picture. In the UK, overseas fees are normally classed as those from students originating from outside the European Union. If EU student fees are also factored in (the figure can be estimated using student numbers data), total overseas fee revenue in the UK hit £5.3 billion in 2015-16, or 15.2 per cent of income, a bit nearer to Australia’s share.
In terms of individual universities, the importance of overseas fee income naturally varies a lot between institutions. But the patterns are a little different for the UK and Australia.
Looking at the contribution that overseas fees (including from EU students in the UK) make towards total fee income, it appears that many more universities in Australia have a higher reliance (say, above 30 per cent) than in the UK.
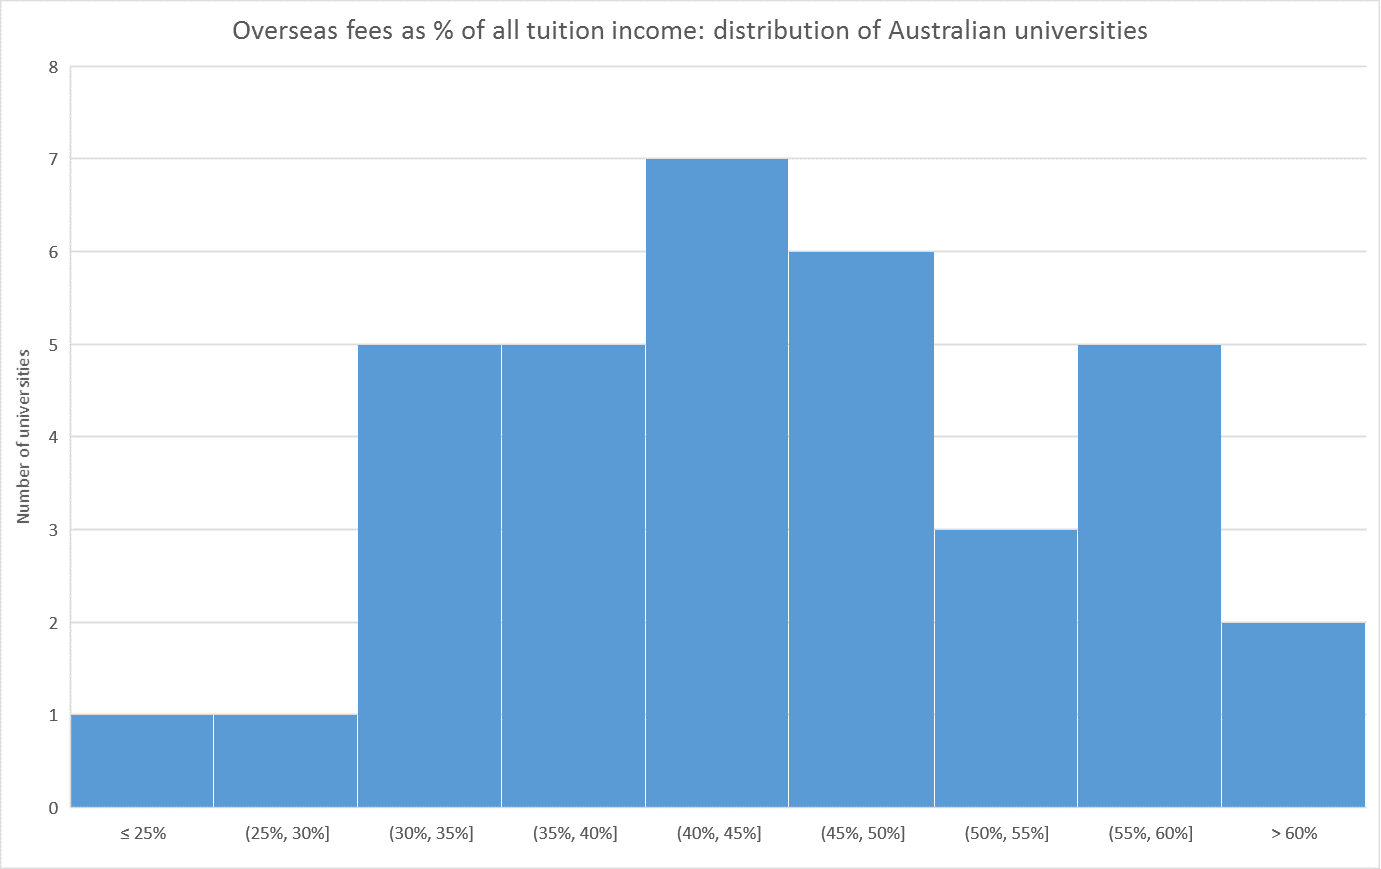
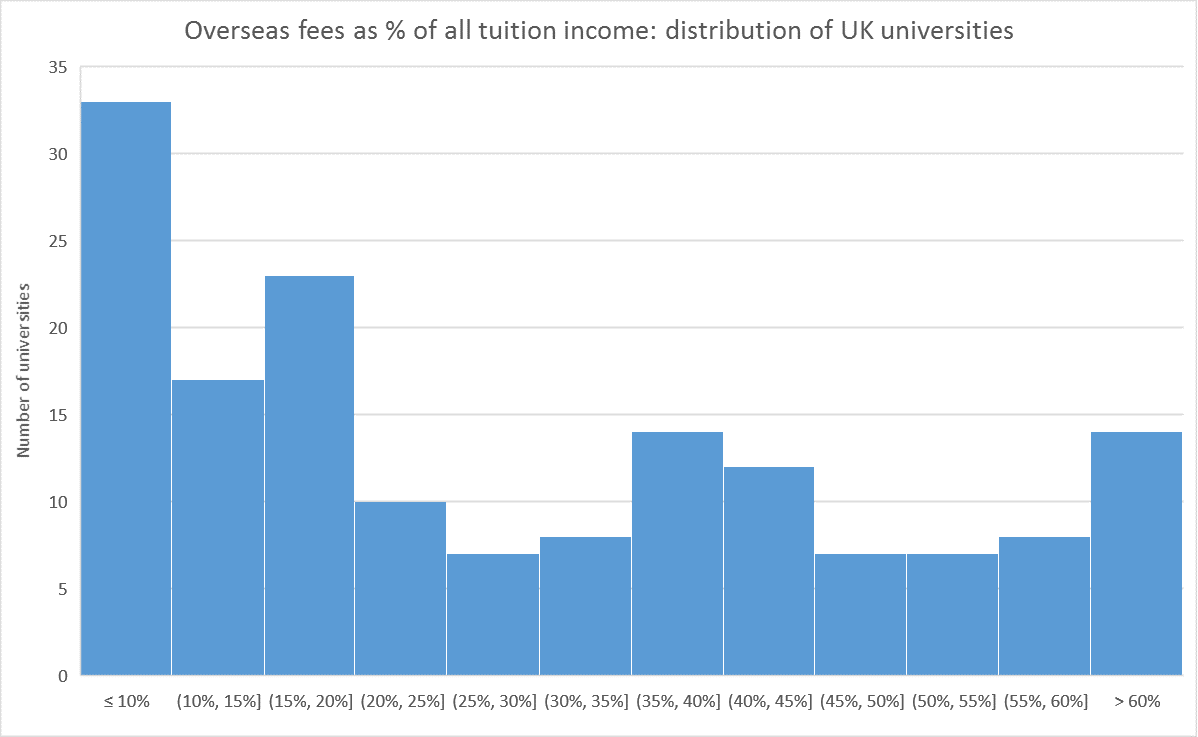
This potentially reflects the fact the UK has a lot more small, specialist and regional universities than in Australia, where a greater proportion of institutions have a global outlook.
Such a theory also appears to be backed up when looking at the names of the universities in each country where overseas fees make up the biggest share: they include some of the most recognised internationally (such as the universities of Melbourne and Sydney in Australia or the London School of Economics and Political Science, and Imperial College London in the UK). However, interestingly, the UK institutions with the biggest shares rely more on overseas fee income than the Australian universities at the top of the list.

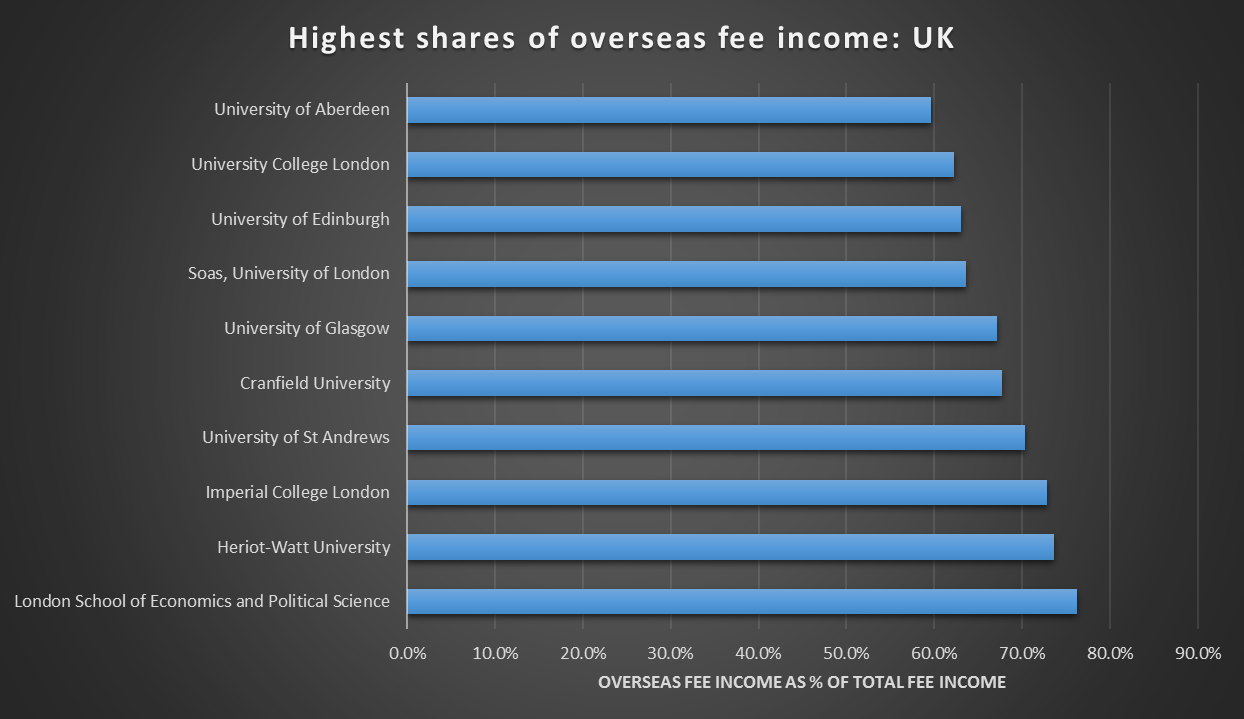
Meanwhile, the UK list also has many Scottish institutions, reflecting the fact that domestic fees are free (so making overseas fees more prominent as a share of the total).
Find out more about THE DataPoints
THE DataPoints is designed with the forward-looking and growth-minded institution in view
Register to continue
Why register?
- Registration is free and only takes a moment
- Once registered, you can read 3 articles a month
- Sign up for our newsletter
Subscribe
Or subscribe for unlimited access to:
- Unlimited access to news, views, insights & reviews
- Digital editions
- Digital access to THE’s university and college rankings analysis
Already registered or a current subscriber? Login


